Early Quant Screening Research for a Winning Edge 

By Cliff Kane, Senior Director, New Business Development @ EyeSee 

At the recent Quirk’s Chicago conference, I had the pleasure of sharing the stage with Shilpa Khanna, Associate Director of Transformational Growth at The Clorox Company. Shilpa’s extensive experience and unwavering dedication to innovation within the CPG industry positioned her as the ideal expert to discuss the do’s and don’ts of launching new products. Our primary aim was to demonstrate effective strategies for building confidence in new packaging decisions and launches. Our discussion covered: 

  • The symbiotic relationship between quantitative and qualitative insights. 
  • The pivotal advantages of early packaging tests compared to delayed evaluations. 
  • The indispensable significance of testing within the context of simulated in-store scenarios, rather than solely in isolation. 

In this blog post, I’ll take a closer look at key insights. For a comprehensive understanding, I highly encourage you to watch the full session recording.

The symbiotic relationship between quantitative and qualitative insights  

Let’s face it – innovation is tricky.  
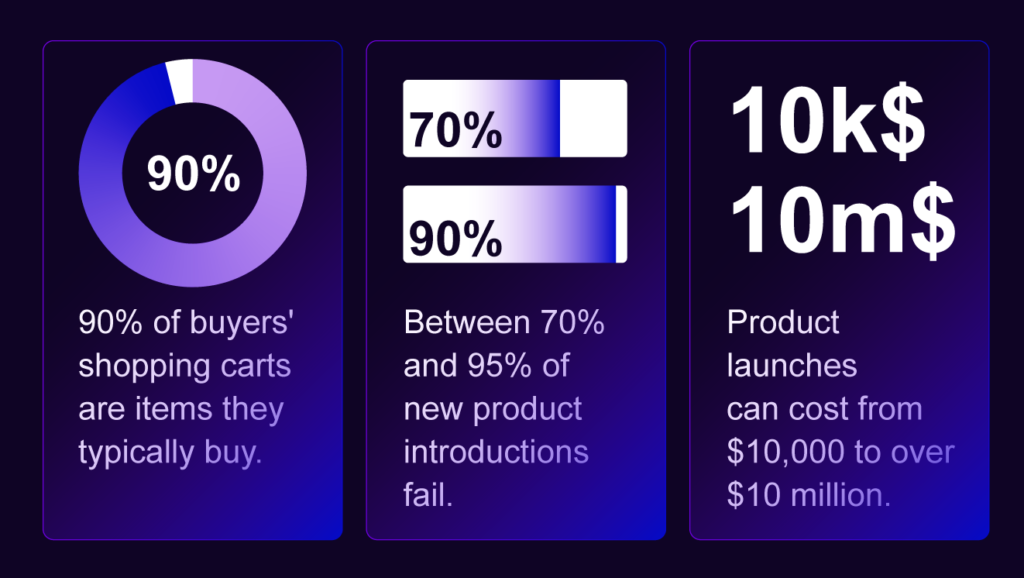
Within the highly dynamic and complex process of product development, packaging design serves as a linchpin for consumer engagement and purchasing decisions. Getting the packaging just right can be costly, as visually communicating a new-to-market proposition carries certain risks and requires alignment with ever-evolving consumer preferences.  

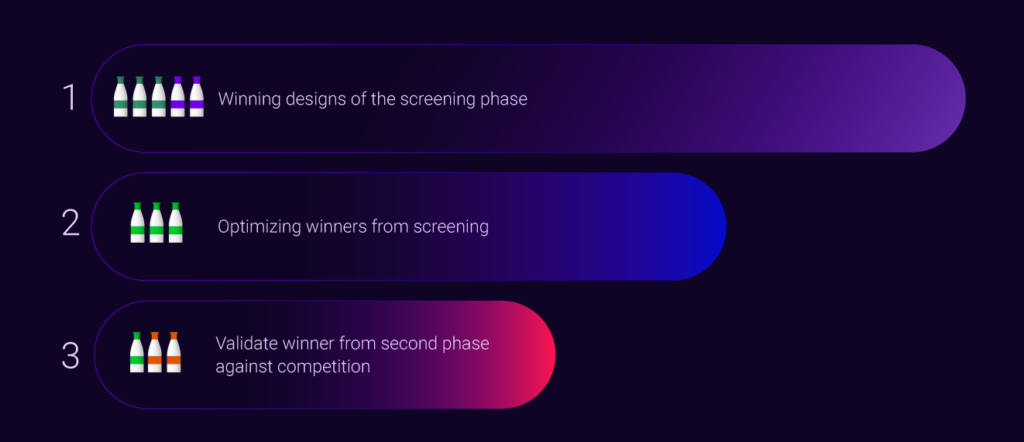
Traditional pack development often advises starting with qualitative studies to evaluate a range of design options, followed by quantitative research to validate a few “finalist” ones. However, the initial screening phase is critical. It’s like choosing the right path in a forest; if you go wrong at the start, subsequent adjustments matter little. So, objective assessments of what drives success are vital from the beginning. Starting with quantitative research to identify winning concepts enables refinement and validation, laying a strong foundation for success.
Advantages of early packaging tests compared to delayed evaluations  

In the overall product development process, packaging is often perceived as the final embellishment to an exceptional product. In reality, it serves as the enticing red door that captures consumer attention, drawing them in to explore and engage with the product experience. Therefore, packaging development and assessment should occur in tandem with the core product, ideally at the earliest stages of development. During our conversation, Shilpa strongly emphasized the necessity of proactive pack design testing, serving as a guiding light to inform strategic decisions and mitigate risks: 
Amid the array of early-stage testing options — from traditional qualitative studies to a multitude of DIY and AI tools — making a methodology choice can be daunting. Personally, I find the behavioral mix approach, incorporating MaxDiff analysis, particularly promising for yielding effective results. At EyeSee, our team employs this method to pinpoint winners, offer recommendations for optimizing successful packs further, and contribute to finalizing subsequent iterations of pack design. 

The ultimate reality check: Testing designs in simulated in-store scenarios vs in isolation

During our discussion on innovation, Shilpa mentioned one new product launch case that stood out as particularly intriguing. Initially, packs featuring a unique cap color and shape emerged victorious in early-stage and standalone assessments. However, when introduced onto (virtual) shelves and compared with others in the category, the tide had turned. A completely different design was ultimately picked for launch.  

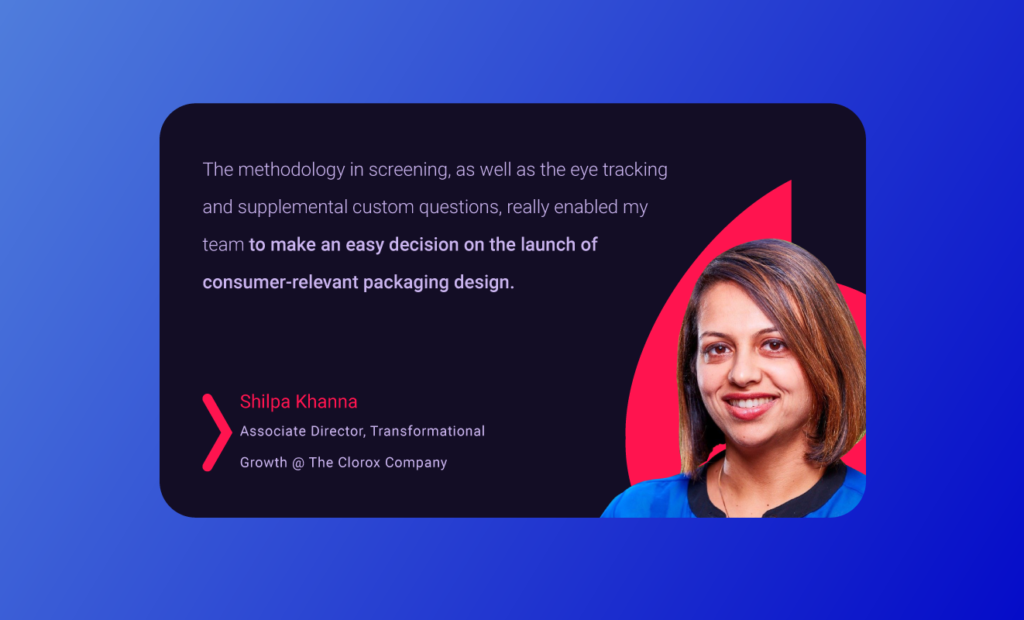
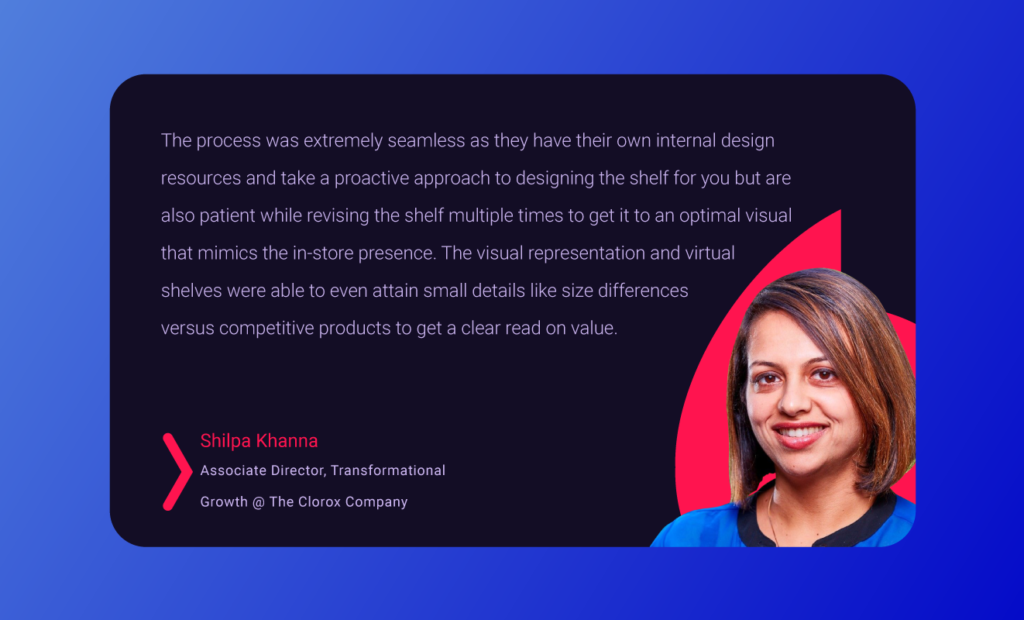
Centering on the importance of context, we explored the perspective of the challenger within the category. The “newcomer” on the shelf must distinguish itself more prominently to compete with the leader. The harsh truth is – what doesn’t stand out has little chance of being purchased. The evaluation of Clorox’s late-stage packs would have yielded vastly different results without testing in the shelf context. The intricacies of the store and real-life purchasing environments provide the most authentic and predictive insights into how the pack will perform post-launch. Reflecting on the whole collaboration, Shilpa shared: 
In conclusion

Innovation in early-stage packaging design testing requires a delicate balance of collaboration, creativity, and strategic vision. By redefining conventional approaches, leveraging data-driven insights, and prioritizing consumer-centric design, you can instill confidence and enhance the prospects of a successful new pack launch. Moreover, the importance of testing within simulated in-store scenarios cannot be emphasized enough; a comprehensive evaluation of a new product’s potential is not complete without consideration of its pack design performance amidst crowded shelves and competing products. 

For more insights and the story of Shilpa’s knowledge gained from not-so-successful new product launches, go to the full session recording that is available here.


Want to know more about pack optimization? Dive deeper and learn how to choose successful claims!

    [White Paper] TikTok First Content Guidelines for Powerful Ads

    Your ads and messages are alright, but you’re itching for something new and exciting. Want a way to jazz up your brand, make it pop, and get people buzzing again?

    The next frontier for marketers globally is to harness the power of your brand on TikTok! An incredible 81% of users say TikTok videos influenced their recent purchases, and a recent EyeSee study discovered that 56% of sponsored content is seen on average, and 73% of users like the ads they see. Gen Z is also redefining search: They’re more likely to use social networks than search engines when looking up brands, products, or services, according to GWI, and 50% of them will choose TikTok. 

    TikTok First Content Guidelines are now available!

    So, if you are wondering how to effectively break through the clutter while still conveying the right message with a fresh approach, “TikTok First Content Guidelines for Powerful Ads” is the white paper for you! Discover:

    1. Why is the TikTok First approach more effective than TVC-style ads? When created in TikTok First style, the ad’s stopping power increases by 17%.

    2. What can earned attention and emotional connection do for your brand? Skippable ad formats like TikTok represent true eyes on the screen. Viewers truly see what they look at, as opposed to just gazing over it. 

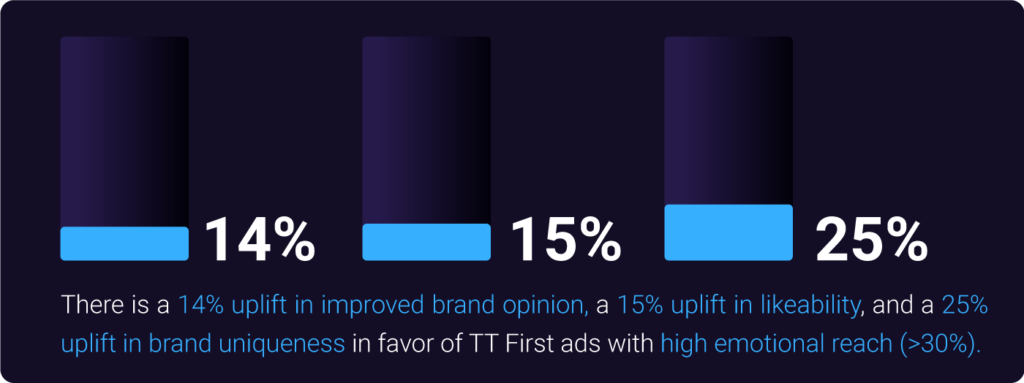
    For content that achieves high emotional reach (>30%), it is noted that there is a 25% uplift in brand uniqueness, a 15% uplift in likeability, and a 14% uplift in improved brand opinion.

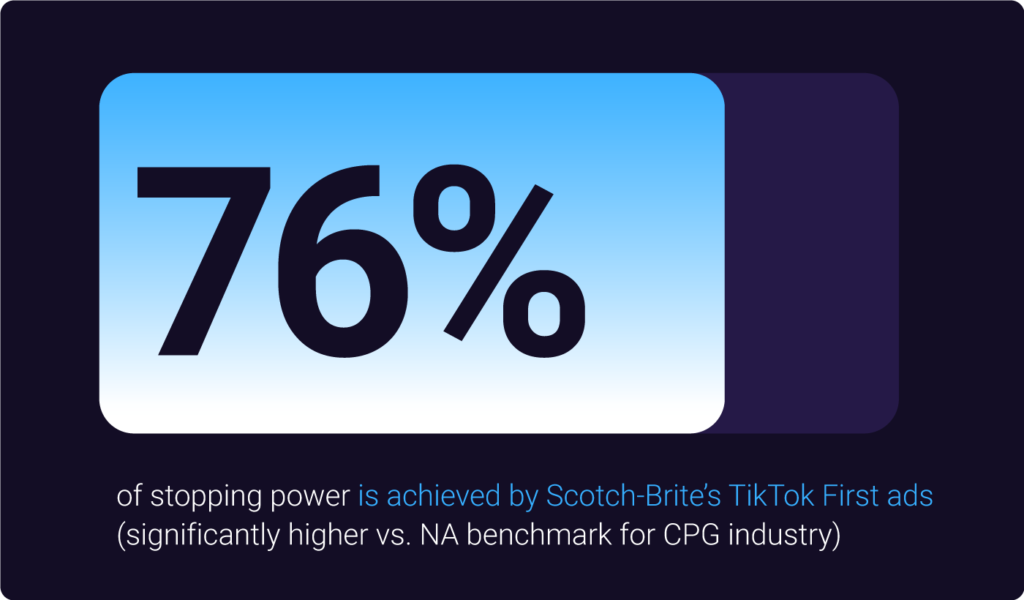
    3. The story behind the Scotch-Brite success story and how they did it. EyeSee study “TikTok ad magic: A performance study” shows that Scotch-Brite ads, created in a TikTok First manner, achieve an impressive stopping power of 76%, significantly surpassing the North American benchmark for the CPG industry.

    4. What are insight-based guidelines for using the most powerful TikTok effects? There is a 19% increase in brand interest and a 23% increase in brand opinion when the TikTok First ad contains effects such as emojis and stickers.

    But if you want to know the power of music, voice-over, ASMR, product display, and what the recommended narrative approach is, check out the full “TikTok First Content Guidelines for Powerful Ads” white paper now. 


    Eager for more? Read the blog about replicated feeds for authentic behavior here.

      4 reasons why 2024 Insights in focus e-book is a research guide you need

      If you require insights and knowledge to help you achieve clarity on your brand’s growth and development, then the “2024 Insights in focus” e-book is what you need. Get in touch via [email protected] and it will soon be in your inbox! 


      Inside, you will find: 

      1. 8 case studies (about #social_media, #pricing and inflation, #NPD, #shopper and #HFSS, and more) 
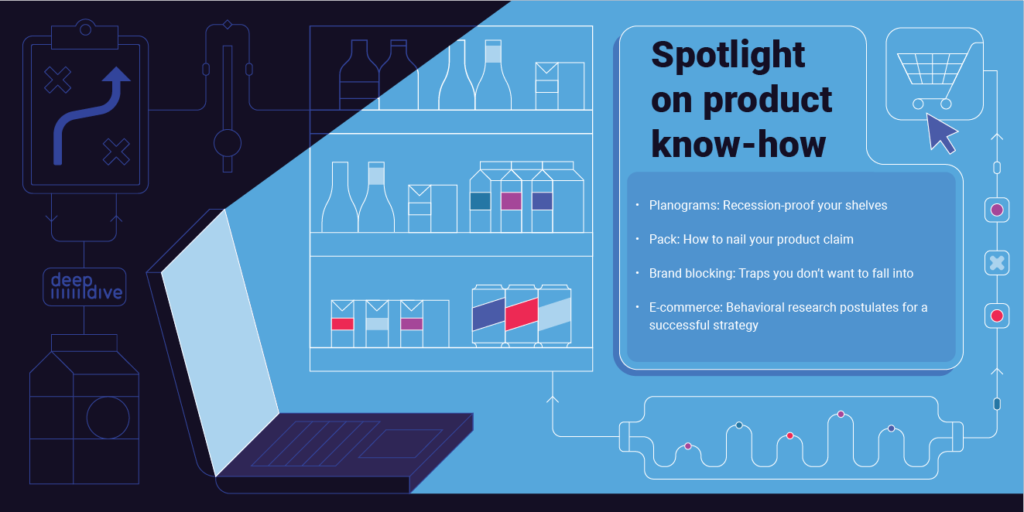
      2. In-depth how-to articles on #planogram, #pack, #brand_blocking, and #E-commerce 
      3. Multimedia presentations on tools and research methods, including demos and webinars 
      4. Countless insights, statistics, and industry best’s quotes  

      This can help you better understand: 

      • Behavioral tech-enabled mixed methods frameworks with which you can test your: Pack, Planogram, TVC, Product Claim, Social Media Ads, Online P2P 
      • How to always be on top of the game with market trends and predictions
      • What answers in-context behavioral mix-method insights can provide you with that sole qual research can’t 
      • How to ask the right research questions for highly predictive insights 
      • How to leverage insight-based knowledge to improve your product, portfolio presentation, and communication 
      • What true consumers’ needs are and how to strategically act upon them 

      Grab your e-copy of 2024 Insights in Focus! Get in touch via [email protected] and it will soon be in your inbox! 


      Are you especially interested in Social Media Ad testing? Read here how to Build on social media ad impact with behavior-savvy strategies.

        Universal Robina x EyeSee: the secret to a successful TikTok campaign  

        By  Xinyu Tok, Senior Insights Manager.

        In the previous article, we already stressed the strong impact that TikTok has on consumer purchase decisions as well as the reach that sponsored content can have if done properly.    

        The figures speak for themselves:   

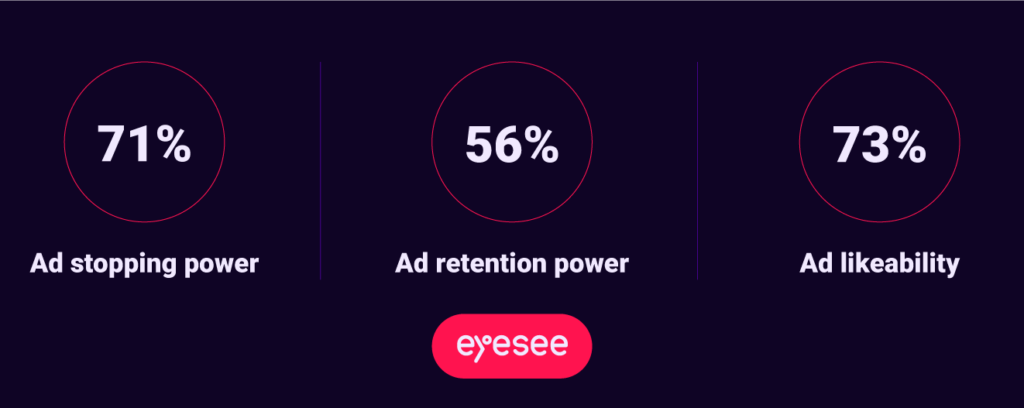
        • 71% of TikTok users stop and watch the first three seconds of the video 
        • 56% of each sponsored piece of content is seen on average 
        • 73% of TikTok users like the ads that they see  

         As we explained, we tested 60 ads from 20 brands across markets and industries such as FMCG (Fast Moving Consumer Goods), Beauty, Insurance, Fashion, Technology, Automotive, Retail, etc. TikTok simulations, standalone ads, and surveys were tested among 7280 respondents. All of the respondents were TikTok regulars who had purchased items from some of the categories in the previous six months. You can request the study walk-through at [email protected]

        Universal Robina is a great study example since their FMCG portfolio is impressive, and they turned out to be one of the winners in the game of TikTok. Let us take a closer look at the testing process and the outcomes.

        What works better: native versus heavily branded approach

        When it comes to ad style, brands typically choose between two options. They either create a single video and distribute it across all platforms, even though each platform has its own set of rules, or they assume that the native approach will win. Of course, creating a single video for multiple platforms is more cost-effective, but the native approach yields better results on a specific platform. However, both of those theories have their ups and downs, and the key is to test them, preferably in a simulated digital environment. By using natural and unforced exposure of the stimuli in an environment as close to reality as possible, we get an objective and accurate insight into the actual ad visibility.  

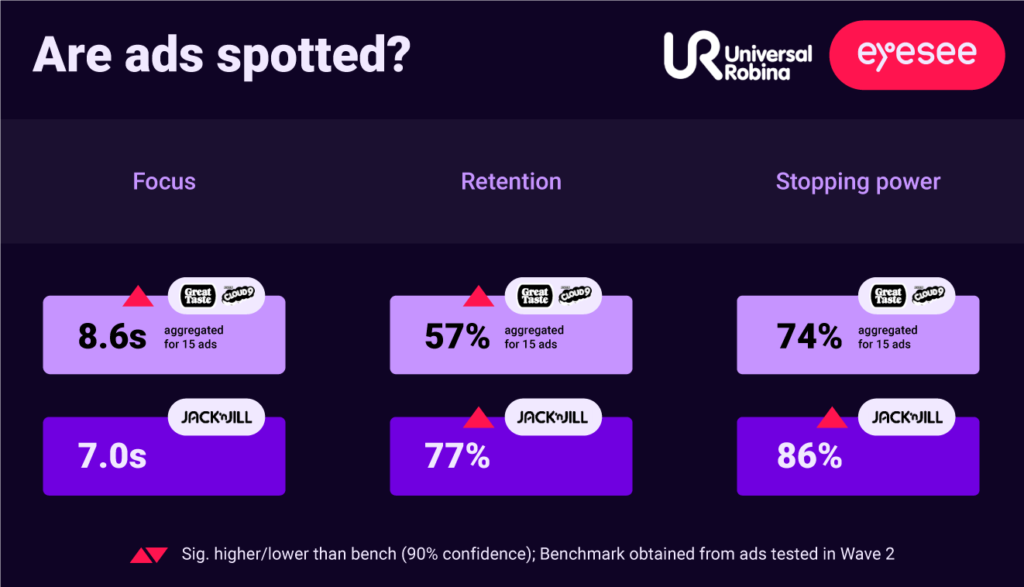
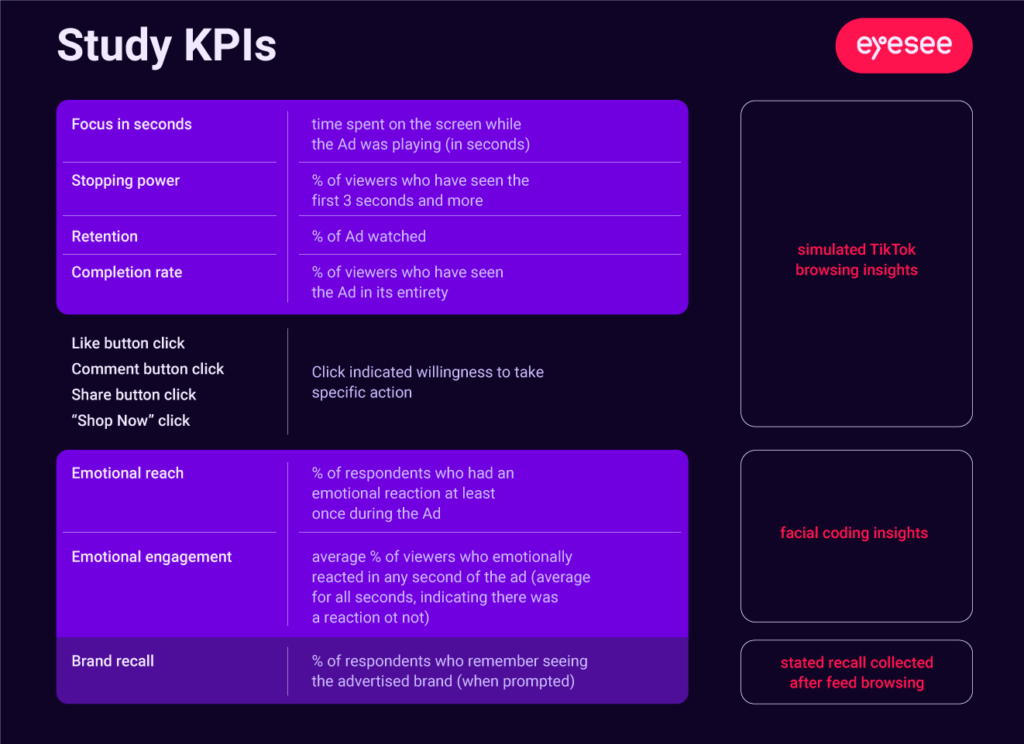
        In the TikTok simulation, respondents saw three videos: an advertisement for Great Taste, Cloud Nine, and Jack’n’Jill. We also consider the focus (time spent on the screen), retention (percentage of people who watched the video), and stopping power (percentage of people who stopped to watch the video) of tested ads.  

        Great Taste and Cloud Nine ads performed better than Jack’n’Jill in terms of focus, with 8.6s vs 7s; however, because Jack’N’Jill used a more native organic approach, it performed better in terms of retention and stopping power. (77% vs 57% and 86% vs 74%).

        But does this necessarily imply that Jack’N’Jill performed better in terms of brand visibility? Not necessarily. With the organic approach, there is always the risk that the video will be insufficiently informative and that the key message will be missed.

        What prompts TikTokers to recall brands more?  

        It is important to note that not only are all three tested stimuli different in style, but they also place the product in a different place in the timeline. Great Taste and Cloud Nine commercials have great dynamics and upbeat music, and the Jack’N’Jill approach is more raw and native; however, both approaches scored good brand recall, with only 2% of the difference in favor of Jack’N’Jill (74% vs. 72%).   The key finding, however, is that watching the entire video increases brand recall by 35% compared to viewing only half of it. 

        Key findings  

        Universal Robina ads performed extremely well, so one of the key takeaways is that they should maintain TikTok content style while also maintaining their core brand attributes. They succeed in keeping users’ attention by using upbeat music and video dynamics, and they get their message across.

        Oversimplification of the video should therefore be avoided. Because user attention is difficult to maintain, quick changes of scenery rather than just one setting are preferable. And, as previously stated, a native approach is not without risks, so whether it is appropriate for your brand depends on the strategy and campaign goals.

        However, to see the full results of the Universal Robina study and to learn more about post-pandemic shoppers, watch the video below. There you will find the full presentation that debuted at the Asia Research Breakfast, which we were fortunate to attend as guest speakers. Also, don’t forget to acquire the whole study walk-through at [email protected]


        Interested in reading more about global TikTok study? Click here.

          Tap into hidden potential with new TikTok creative insights

          TikTok is an undeniably influential social media platform with significant untapped potential for sponsored content. Following the pandemic, our habit of using TikTok remained strong. The app enjoys one of the highest user retention rates globally. An incredible 81% of users say TikTok videos influenced their recent purchases. That is why it is becoming increasingly important for brands to understand how to create effective ads that resonate with their consumers.  

          According to our most recent two-wave global study, we discovered that 71% of TikTok users stop and watch the first three seconds of the video and that 56% of each sponsored content is seen on average. All of this is supported by the fact that the ads are liked by 73% of TikTok users.

          These figures show that sponsored content has every reason to thrive in TikTok’s digital environment. However, brands are still not using their full potential. This study not only invites you to use TikTok to empower your brand, but it also gets deep into what you must keep in mind while doing so. If you are interested in getting an expert walkthrough of the study, write us at [email protected]  

          Methodology

          As previously stated, we tested 60 ads from 20 brands across markets and industries such as FMCG (Fast Moving Consumer Goods), Beauty, Insurance, Fashion, Technology, Automotive, Retail, etc. TikTok simulations, standalone ads, and surveys were tested among 7280 respondents. 


          This research is built on the following key pillars:    

          • Ad stopping power (tested the ads in a simulated TikTok environment that provided us with browsing insights)    
          • Ad retention (tasted by exposing respondents to a simulated TikTok environment)    
          • Ad emotional reach (tasted by exposing respondents to standalone ads and utilizing face coding methodology)    
          • Ad likability (tasted by exposing respondents to standalone ads and utilizing face coding methodology)    
          • Brand recalling (to learn % of respondents who remember seeing the advertised brand when prompted, we used the survey method) 

          The challenge of TikTok advertising

          Why don’t brands use TikTok more? This is the imposing question that arises when we look at the numbers that show the untapped potential. On one hand, we have the answer that for brand managers, it is hard to follow the ROI once they invest in TikTok ads. They are unsure how to follow the path and make a clear connection, or better to say, they are unsure how to follow the path to purchase from the TikTok ad to the shopping cart. 

           On the other hand, even when clarity in that field is gained, the questions of how to approach strategy and what works best remain. There are questions about what will work better – the native approach or strongly branded videos that will also work on other platforms; what is the reach of animation as the dominant style; and is co-branding the way to more followers and engagement or the way to poor brand recollection? 

          This study answers all those questions and beyond. For example, animated video ads, those containing any kind of computer-generated imagery, will improve brand opinion by 23% and increase brand interest by 19%, while elevating the positive emotions about the brand by 20%.  

          However, brands must be careful; there is a chance that they will be seen as less informative than conventional videos if the message and narrative in them are not constructed carefully.  

          The golden rule for unlocking the untapped potential 

          What is great about this report is that it contains a lot of simple facts that must be considered in future ad planning. For example:   

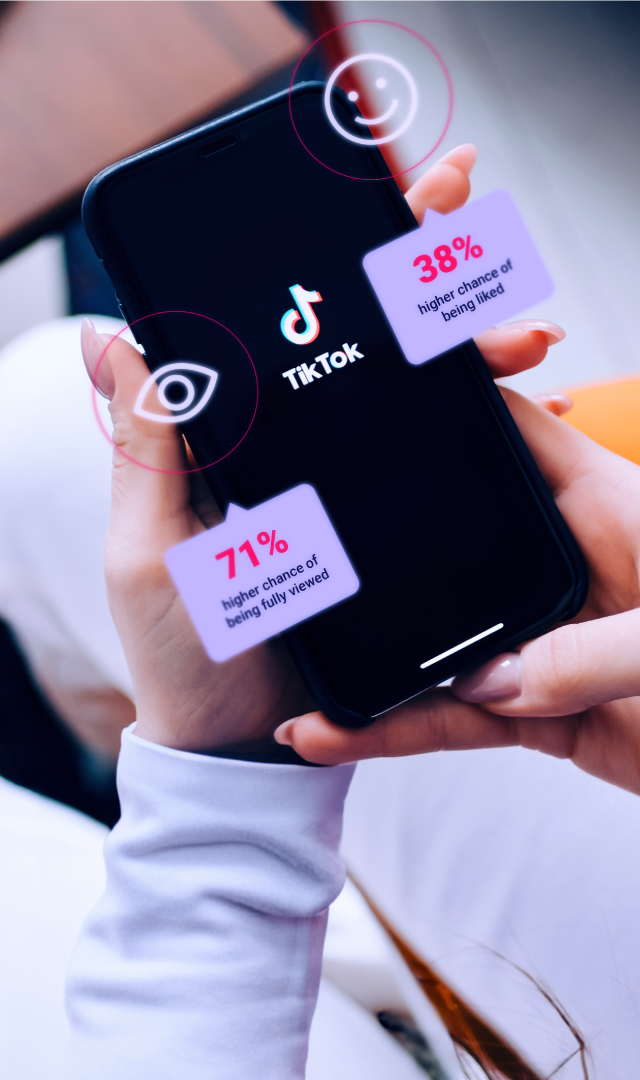
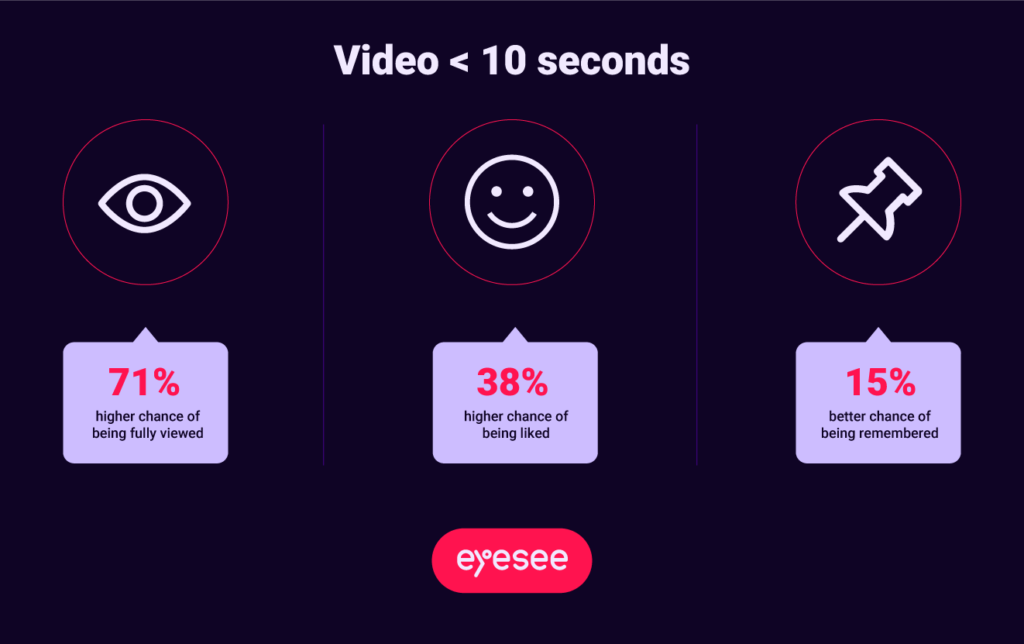
          • If the ad lasts up to 10 seconds, it has a 71% higher chance of being fully viewed.  
          • A video that lasts up to 10 seconds has a 38% higher chance of being liked.  
          • If the brand lasts up to 10 seconds, it has a 15% better chance of being remembered.  

          This is an example of an insight finding that makes a strong recommendation that is universal around the world. However, in this report, there are far more complex recommendations that necessitate a thorough examination of both specific brand values and the TikTok environment. 

          All of this is only the beginning. If you want to learn more, send an email to [email protected] and we will provide you with a video expert walkthrough of the study. Not only will you get the big picture and the future framework for making strategic TikTok ad planning decisions, but you will also be able to formulate specific questions for your specific pain points, which we will gladly assist you with.  

          Request access to

          TikTok creative study findings!


          Eager for more? Read the blog about replicated feeds for authentic behavior here.

            Post-pandemic consumer: restraints strengthen cravings    

            by Mirna Djuric, Product Capability Director at EyeSee

            The world has gone through quite a few disruptions over the last three years. According to CPS GfK over 60% of European households are in or close to a serious budget squeeze, with Western European countries, especially on the rise. Nearly 2 in 3 consumers declare to cut their out-of-home (OOH) spending, including visiting restaurants and bars, buying clothes (-48%), as well as gifts, decorations, and takeout/delivery (all at -46%).   

            But even though shoppers are more focused on preparing meals at home, the EyeSee meta-analysis shows that the food part of FMCG has suffered the most. This meta-analysis is based on 250 studies in the FMCG category. Samples ranged from 50.000 to 150.000 respondents per method, spread over 4 geographies – US, Europe, APAC, and Latin America. They included methodologies such as Eye Tracking, Facial Coding, Virtual Shopping, and surveys, and they were all done in highly realistic shelf environments that, 95% of the time, matches actual shopping behavior.   

            After gathering all the data, it was grouped into pre-pandemic (2018 and 2019) and post-pandemic and all subsequent events (2020-2022), and eventually compared.  

            Food category products are more likable but less bought  

            It does not appear obvious that in times when shoppers are spending more time preparing meals, food would be the most crisis-influenced category in the FMCG category. However, if we remember that one of the key takeaways from the EyeSee pricing study was that the main goal of shoppers is to spend as little as possible, even if it means buying smaller packs of products and getting less value for their money, we may be able to gain a better understanding of this type of behavior. Food products are the ones we buy every day, and we can see their price increases getting higher and higher, whereas, in other non-food categories, we do not buy as frequently, so we do not have a sense of their impact on our overall budget.  

            However, when shoppers are directly asked about the products, they will react positively and describe them as highly desirable, keeping in mind that we all want to resume our pre-pandemic lives as soon as possible. But what they will buy is a different story.  

            In the food segment of FMCG, both consideration and penetration rates have decreased by more than double. Simply put, fewer people are buying fewer products, and competition on the shelf is fiercer.   

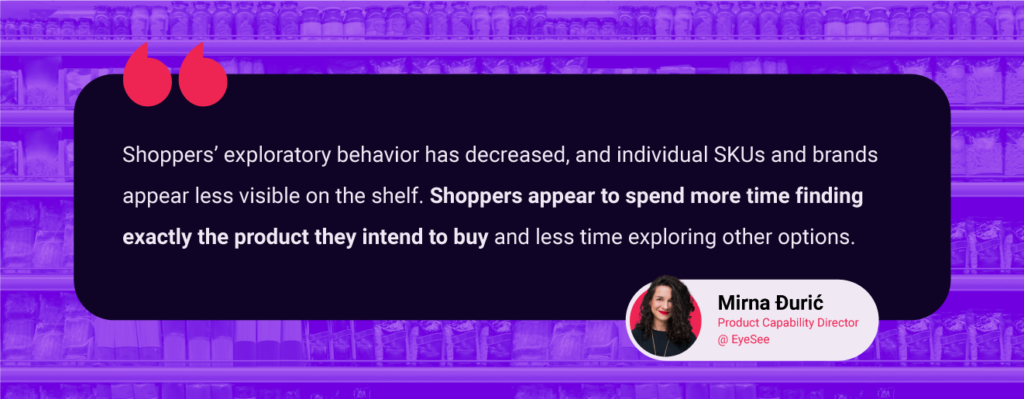
            Shoppers’ exploratory behavior has also decreased, and individual SKUs and brands appear less visible on the shelf. Shoppers appear to spend more time finding exactly the product they intend to buy and less time exploring other options.  

            Visibility in the first 5 seconds dropped significantly, as did attention to the key zone, meaning shoppers’ exploratory behavior decreased and they are possibly spending time on shelves analyzing price tags instead of browsing products.  

            However, the likability of products significantly increased, meaning they were found to be more and more attractive and relevant.  

            Is e-commerce a saving grace for FMCG in the US? 

            With increased e-commerce spending, we can expect that FMCG in the US will potentially remain healthy. It is also interesting for this market that on the pack navigation, the US stands out by brand importance.  

            This is the only region where brand logos are gathering more consumer views. Like other markets, secondary images lost visibility while claims gained it. This suggests shoppers want to be more certain they are getting the product they intended to buy beforehand, meaning shopping is more targeted.  

            Very similar patterns are evident in the European markets as well; although actual shopping hasn’t yet universally decreased, there are indications that shoppers are more cautious (relying on tried-and-true brands) and therefore less exploratory.   

            The nonfood category remains stable but claims gain importance  

            Even though non-food products are still in the same or similar demand, and even though post-pandemic cravings among shoppers are strong, when spending money in times of crisis, they may feel the need to justify their spending, so they will turn to claims and question them, having more information now than during carefree pre-pandemic times.  

            This higher level of caution is confirmed when looking into navigation patterns in the non-food category. Claims have gained significantly more consumer looks resulting in a 50% increase in claim visibility. Other pack elements, particularly imagery, both primary and secondary, suffered in consumer attention.  

            Our packaging and claim expert, Tijana Lukic, provides more context in terms of what post-pandemic consumers look for in the non-food category.  

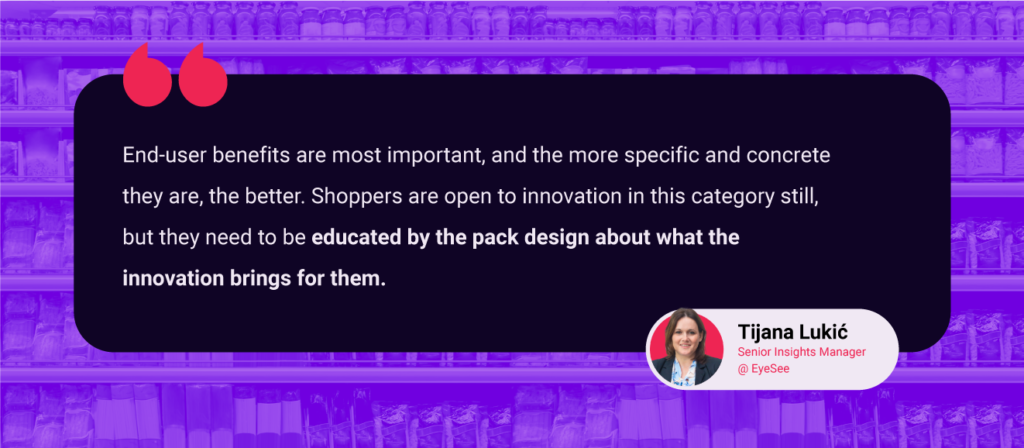
            “End-user benefits are most important, and the more specific and concrete they are, the better.“ She also notices that shoppers have become true experts, they are knowledgeable about ingredients, their benefits, and their risks, so they choose cautiously.   

            “Shoppers are open to innovation in this category still, but they need to be educated by the pack design about what the innovation brings for them. So, the concrete benefits are appreciated. Sustainability of the product is important, but it hasn’t exited the nice-to-have category yet in most non-food categories.”  

            Latin American market can expect further decreases in FMCG   

            In the Latin American market, on the other hand, shelf purchases significantly decreased, but not only that; consumers are consciously saving. Even stated purchase intent, which usually lags the actual purchase, shows a decrease in this market. This suggests we can expect further decreases in FMCG in LATAM.    

            Conclusion  

            With all of these insights in mind, it is evident that different markets show different results depending on their strengths and weaknesses. However, the pressure of one crisis after another can be more or less felt everywhere. Even though the average consumer wishes to go back to his previously carefree life and spending, their budgets simply do not allow it.   

            From the producer’s perspective, category leaders are under more pressure than ever to sustain their market growth. If you are interested in this topic and want to learn more, register for GreenBook X EyeSee webinar on How Category Leaders Adapt to Post-Pandemic Consumer Behavior here – https://bit.ly/3Kwcs7D 


            Interested in findings from our pricing studies from the US and which categories have we researched? Read all about it here or you can check out the full webinar featuring Heather Graham (Director Client Service @ EyeSee), Sasa Radojevic (Sr Shopper Insight Manager @ EyeSee), and experienced retailer & Awarded 2022 Top Women in Grocery (TWiG) Raina Rusnak.

              Brand blocking traps you don’t want to fall into 

              By Bratislav Stefanovic, Senior Insights Manager at EyeSee

              Brand blocking has long been a go-to merchandising technique for brand managers looking to ensure their brand stands out on the shelves. Although it may not seem obvious, there are several challenging questions that need to be addressed when applying this technique:  

              • Is the brand’s portfolio broad enough so it would pay off, but not too broad to induce a paradox of choice? 
              • What is a wider shelf/category context: price thresholds, competitors, anchor points?  
              • Will brand blocking of certain brands support or disable category growth?  

              All these dilemmas arise from the fact that brand blocking is impactful on two different levels, brand growth, and category growth, and the key to success is to reconcile and align those two. To understand how to do that, we should first look at shoppers, brand managers, and category managers’ points of view separately.  

              Brand blocking impact on consumers 

              According to the Food Marketing Institute, a traditional supermarket has from 15.000 to 60.000 SKUs, or around 40.000 on average. This means that there are an enormously large number of stimuli “attacking” consumers from the shelf, so for their “defense”, they use all sorts of anchors not to feel lost. Sometimes that is a price, emotion, or a clearly communicated claim.   

              Simply put, in the overwhelmingly large and diverse rows of SKUs, things can get complicated, which nobody wants. Complexity leads to indecision, which could lead to walking away from categories and products.  

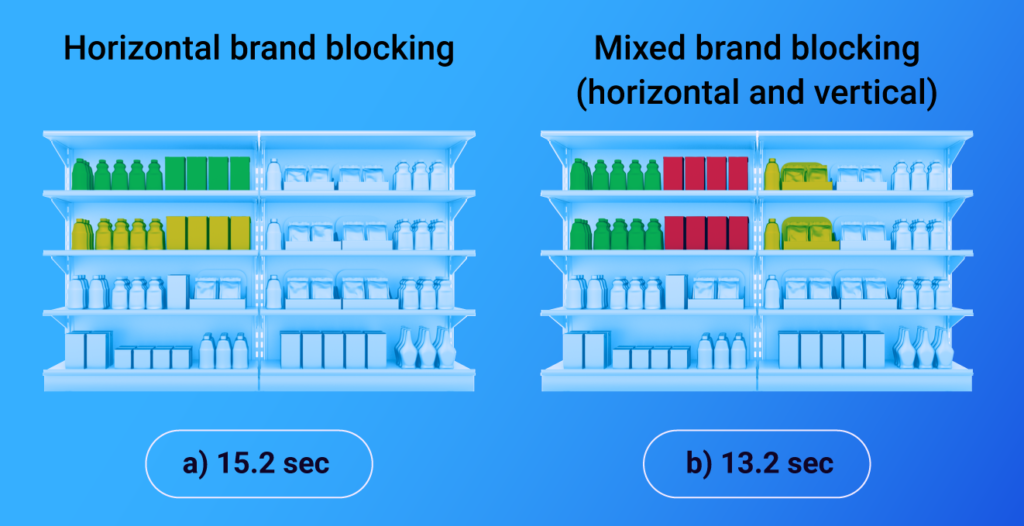
              That is why blocking should help consumers scan through shelves, allowing natural browsing patterns like book reading. It is believed that horizontal blocking makes them spend more time browsing, noticing new SKUs and smaller brands, while vertical blocking ensures loyalty and decreases switching behavior.  

              However, in a recent EyeSee study, it was proven that horizontal brand blocking of one brand, which at the same time utilizes vertical brand blocking of its subcategories, can result in a visible increase in sales.  

               With the speed of the “shelf scanning” cut for 2 seconds, that methodology provided 32% of sales growth. However, while this type of blocking prevents price comparisons with potentially cheaper competitors, if not placed wisely, it could experience potential cannibalization. And this leads us to a question of the brand manager’s point of view. 

              Is brand blocking really a must for all brands? 

              Brand blocking for brands looks like a no-brainer: the product is clearly visible from afar, it takes up more space, and more importantly, it covers a larger surface in the consumer’s field of view.  

              The whole brand portfolio should come from the same key visual that allows brand creativity to emerge. Aside from the lead color scheme, they use visual connectors, some kind of characteristic design detail that connects the group of products: a logo, a circle with the claim, a line, or even the illustration of a cat on the box of milk, whose figure is complete when we look at the product facings.  

              Heineken has its famous red star, and Coca-Cola has its characteristic typography with an underlying lineage.    

              Pack tests in a realistic shelf setting can and should be used to determine whether the pack is outstanding enough, has a clear claim, and has a strong point of difference in comparison to competitors. 

               However, the impact of design is not the only thing that is relevant to shoppers. Price, or value for money, plays an important role as well. For example, if we put a large pack of products from the same brand next to or close to a smaller but premium pack and they have the same or similar prices, shoppers will compare those two segments of the same brand portfolio and will use the “cheaper” one as a threshold. In this case, brand blocking can be counterproductive unless Decision Three testing is used, which can help brand managers understand the role of every product in their portfolio and how it serves different target groups. 

              The category manager’s role in brand blocking   

              By using Decision Tree or Conjoint testing, category managers can get answers on whether it is the strength of the brand or price that will influence the shopper’s purchase, but in order to find an optimal solution, that will not be the only aspect they have to integrate into their decision making.  For category managers, category growth is, understandably, their top priority, and brand blocking can both help and sometimes stand in the way of that growth.  

              Brand blocking helps in the case when:  

              • brand’s strengths help consumers identify certain subcategories or segments, such as health or occasion-based ones  
              • brand is a category leader and a strong driver of innovation and change  
              • brand assortments, or planograms, are already made with a category growth mindset  

              On the other hand, they must pay attention to the following:  

              • brand blocking by brands that do not innovate, or change can lead to status-quo and the fallout of both brand volume and category  
              • brand blocking can decrease the time that consumers spend shopping – they make decisions before coming to the store, disabling impulsive shopping on POS, which results in a smaller number of SKUs in their basket, which has a negative impact on category growth.   
              • brand blocking isn’t fit for brands that have too narrow brand portfolios; it simply doesn’t pay off.  

              Conclusion  

              When we examine brand blocking from three different angles: consumers, brand managers, and category managers, finding the perfect category planogram is more like solving a Rubik’s cube than painting a nice, branded color scheme on the shelves. 

              However, it is critical to remember that both brands and retailers want the same thing: for products to move and large-volume sales to occur. To be successful, the brands’ growth visions must align with the growth mindset of the category, and vice versa. This necessitates constantly looking at the big picture and making a series of informed decisions supported by data-driven insights provided by a series of context tests of shopper behavior in realistic environments.      


              Interested in category management? Check out our latest Deep dive podcast episode with the Clorox Company Insights Lead.

                Pricing adjustment strategies in APAC: Are you keeping up?

                By Iskra Herak, Sr Insights manager @ EyeSee

                We live in a complex world where consumers face vast financial pressures; however, these pressures are felt differently across the globe. Our team at EyeSee looked into how pricing adjustment strategies affect shoppers; we’ve previously published the key findings for the US market, as well as the more detailed breakdown of four tested CPG categories. Now, let’s take a closer look at the results for the APAC region.  

                How does APAC cope with price increases?

                EyeSee has just wrapped up its first pricing study in this region to identify how consumer behavior is shifting when exposed to different pricing adjustment scenarios. In studies like these, it is important to test various categories, not only prices. The psychology of buying household items and the mindset of buying chocolate are completely different. The frequency of purchase depends on type of product category, even in the unstable times like these.

                Using a conjoint exercise, we looked at four shopping categories:

                • 2 high-frequency categories – sweets and instant noodles
                • 2 low-frequency categories – face moisturizers and antibacterial handwash

                Consumers were shown different options for increased prices – 5%, 10%, 15%, 20% and 25%.

                Different adaptation scenarios are possible, and while an increase in purchasing multi-pack and big size packaging can occur for household items, it is not what would be expected for indulgence products. While certain patterns and cycles re-appear in these situations, if you are a brand, it is important to stay in touch with the consumer through research and understand in which phase of the cycle they are at, at which stage the product category is and consider all those factors to best curb the pressures of the current situation. 

                Here are some of the main findings.

                Back to the basics and functional 

                Regarding low frequency categories, as the crisis prolongs, consumers are very much looking to cover the basics and stick to essentials. It is important for brands to understand that because it is what consumers search for when they are choosing among a variety of face moisturizers and antibacterial handwash. Innovation and flavors won’t be deal-breakers – it’s primarily about simplicity, price, and necessity.

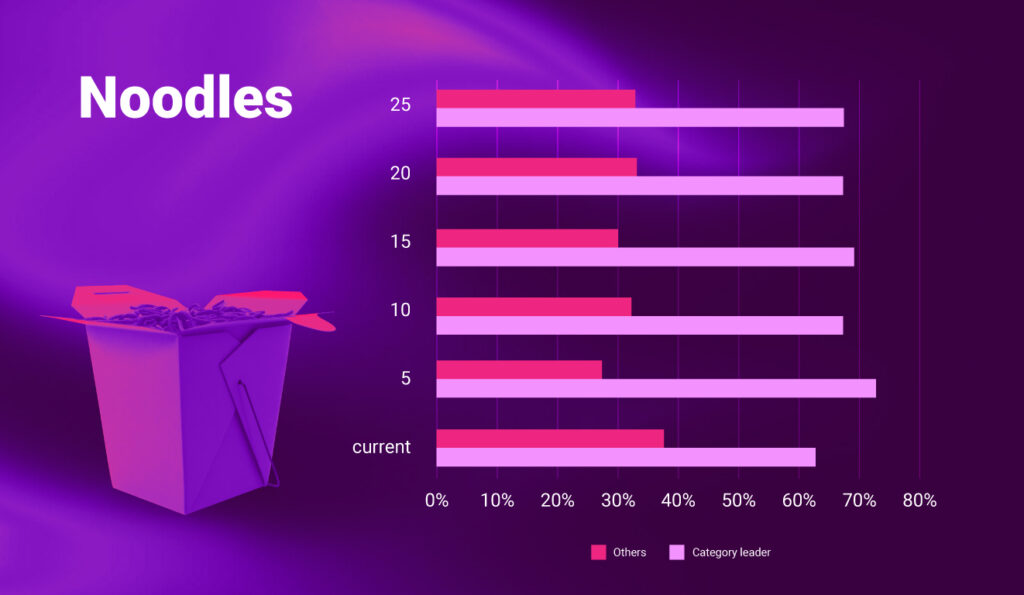
                When it comes to noodles, a product in the high-frequency category, the price of the category leader does not significantly impact consumer purchasing behavior. Even if the price increases, the level of purchases remains relatively stable; consumers’ attachment to the leading and well-established brand is not at risk but rather reinforced. It serves as further evidence that consumer behavior tends to gravitate towards the fundamentals/basics during uncertain times.

                Chocolate, however, is still worth it

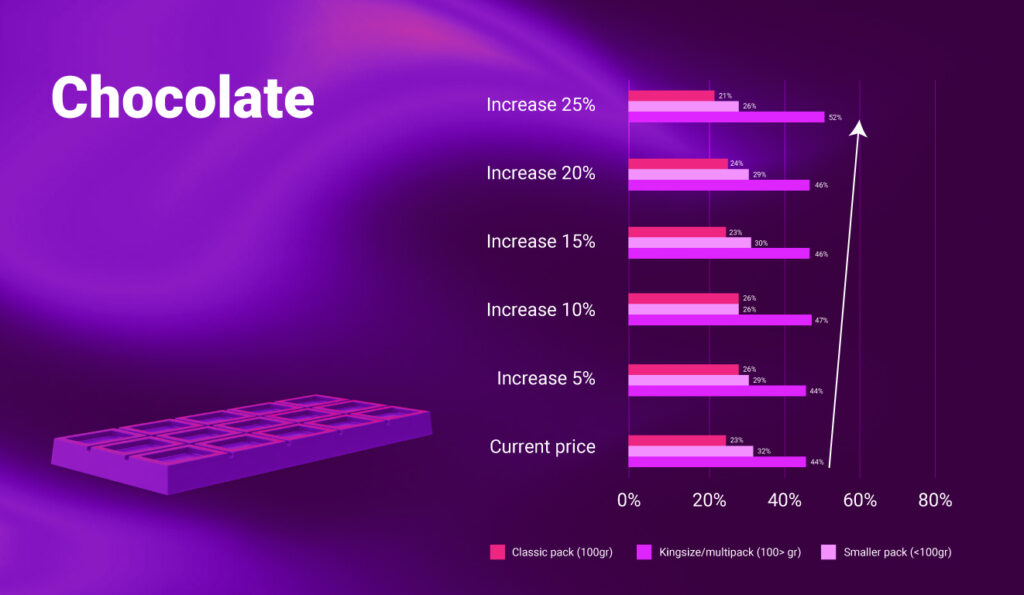
                In our pricing study we had a category of impulse buys, such as chocolates and sweets. We observed that the inflation of prices for the small packs of chocolates doesn’t decrease their consumption. On the contrary – it has increased. At the same time, there is a decrease of consumption of the king size and multipacks with the price increase. Our hypothesis is that it is probably because small-sized chocolates are treated as a small indulgence and something extra consumers don’t want to give up on.

                Knowledge and skill bring calmness and optimism

                In Philippines, around 1/3 of shoppers are price-aware and savvy consumers. They are focused on price, calculate the price per unit/kilo/ounce, and know where to find products on promotions. We found that they are very optimistic with regards to their future personal financial situation, employment security and job options, financial situation in the country, as well as the global financial situation. This is probably because they have a greater sense of control over their spending, so they feel like they know how to budget and don’t feel like they have to renounce anything. Inflation, if the gap between prices and the salary is not too big, won’t ‘break their spirit’ and will keep them spending and optimistic.   

                (Nothing) sweet about inflation

                However, for most APAC consumers, the pressure of inflation is firm, and it affects their behavior a lot. It is highly important to understand the changes in their behavior, their new needs and how it combines to influence the industry. Unpredictable times call for highly predictive insights obtained throughout relevant tools and research.

                Yes, there are many price-aware consumers who can deal with all this financial pressure, but the majority still can’t handle it. They won’t reject small pleasures and treats such as small chocolate, but that is the well-known lipstick effect. In psychology, the lipstick effect describes the observation that consumers will still tend to buy small luxury items even during an economic downturn. Cash-strapped consumers want to treat themselves to something that lets them forget their financial problems and enjoy modest delight and thrill. This can’t be applied in low frequency categories like face moisturizers and antibacterial handwash because rules are different here, and consumers want only the essential and basic.

                Knowing all this,  it’s crucial to understand your specific categories and how consumer behavior can change swiftly depending on the needs and products on offer
                _____________________________________________________________________________________

                Interested in findings from our pricing studies from the US and which categories have we researched? Read all about it here or you can check out the full webinar featuring Heather Graham (Director Client Service @ EyeSee), Sasa Radojevic (Sr Shopper Insight Manager @ EyeSee), and experienced retailer & Awarded 2022 Top Women in Grocery (TWiG) Raina Rusnak.

                  Pioneering HFSS research: Rethink promotion and positioning in store

                  While most of the Western world is currently examining the relationship with HFSS (high fat, sugar, and salt) products, the United Kingdom is the first country to put in place concrete measures to reframe how we access and buy prepackaged goods belonging to the ‘less healthy’ categories.

                  Currently, the measures cover location; no HFSS food and beverage can be placed in high footfall areas of an affected store, like checkouts, end-of-aisle units, store entrances, and designated queueing areas. By the end of this year, restrictions on promotions will come into force, while advertising regulations are scheduled for early 2024. It is only a matter of time before other countries follow suit; the impact on industry will be monumental.

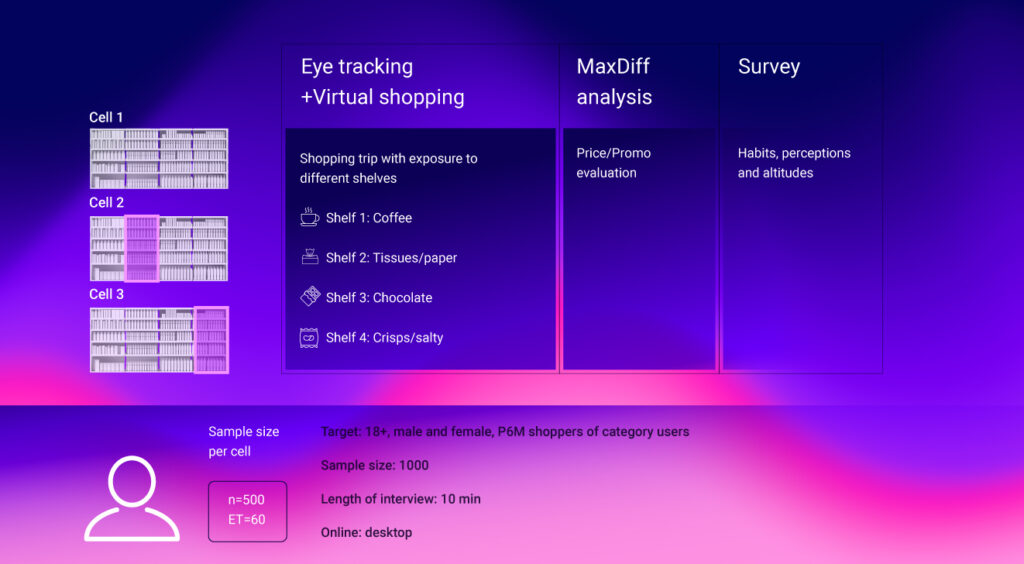
                  To help producers and retailers understand how to adjust, EyeSee’s just wrapped up a behavioral study looking into how product windows and different placements impact visibility and, ultimately, sales.

                  We’ve tested two locations of the product window: at the end of the aisle (Cell 3) and a central position (Cell 2); and compared those to a situation with no product windows (Cell 1), where respondents were merely shopping snacks, chocolate, coffee, and tissues each in their respective main aisles.

                  Here’s the breakdown of our main findings.

                  One thing is certain – shelf windows do attract attention

                  In our study, we set out to test the impact of product windows to help guide the options retailers and brands should consider  when rethinking location and promotions in physical stores. The tests included two common snacking categories – chocolate and salty snacks, as well as two adjacent categories not directly related to snacking – coffee and tissues.

                  All respondents visited the four categories and were given a task to shop for a small gathering at home with some friends; following this, they were exposed to virtual stores and shelves.

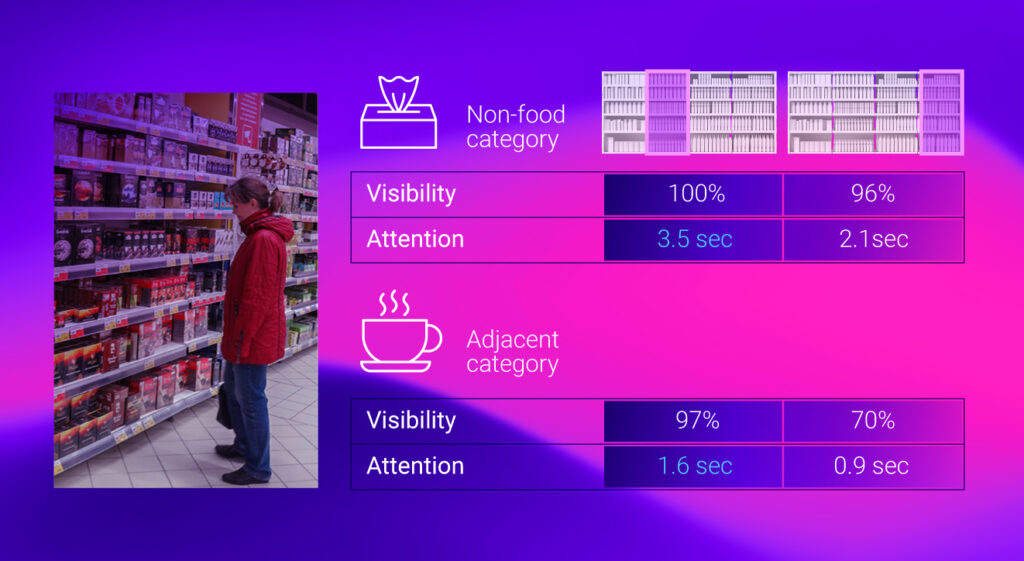
                  Using webcam-based eye tracking, we’ve found that in the tissues aisle, almost all respondents noticed the window regardless of the product positioning. It is prominent and stands out presumably due to the unusual placement of snacks and a surprise factor.

                  In the coffee shelf, almost all see the more central window, but not all look at the window at the end. While in both host categories, the window in the middle also gets longer attention.

                  Unexpected and non-food categories drive purchases

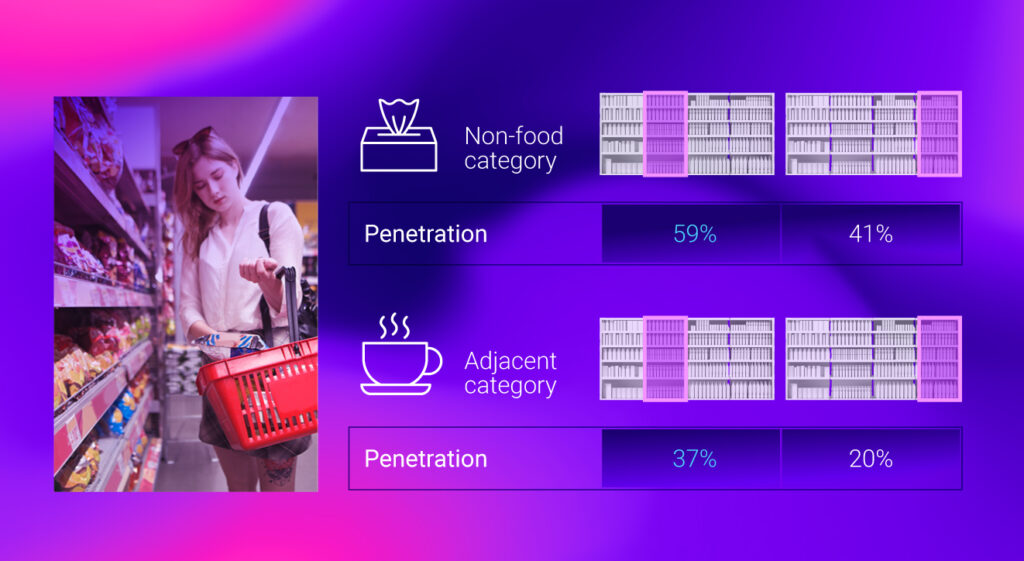
                  Visibility correlates with purchase; what is not seen is effectively not bought. Our virtual shopping tests concluded that respondents are also willing to go beyond visibility and buy from the window.

                  Overall, the middle window attracts more buyers and penetration, as well as purchases. Whether we look at total value or value per buyer, the middle window is more effective.

                  Interestingly, the window in the non-food category has a larger share of shoppers. Potentially more shoppers buy where the placement is less expected.

                  Positive effects on total category sales

                  As it is now, retailers have most of the windows within their own aisle (Pringles in crisps, Belvita or Oreo in biscuits); the ‘TESCO Clubcard’ have a mix of snacking products in snacking aisles e.g. biscuit aisle or in the chocolate aisle; Waitrose offers are a mix of products outside aisles with snacks inside the window.

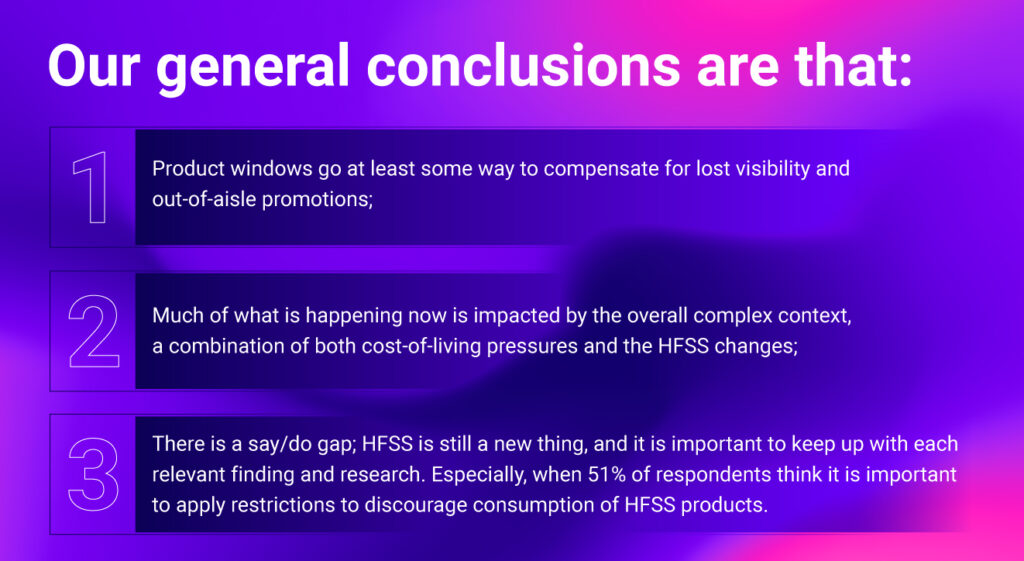
                  However, our data shows that combining the sales from the main aisle of chocolate with the sales from the window helps the category. The window outside the snack or biscuit category goes some way to compensate for the main aisle in terms of visibility and sales. Even without promotions or special prices; simply by being there.

                  More challenging news is that the host categories, in this case coffee and paper products, experience a decline in sales when attention is redirected to the window and having less facings.

                  Conclusion

                  The shopping environment plays an important part in the way products are marketed to us, with simple factors such as the location within stores significantly affecting what we buy. Removing out of aisle promotion locations puts pressure on reframing how shoppers shop and get engaged.


                  Request the full study breakdown at [email protected]! If you are interested in more shopper case studies, check out our latest one on best pricing adjustment tactics for inflation.

                    Fresh pricing study: How do we shop for high and low frequency categories?

                    EyeSee has recently published the second wave of the pricing tracker in the US to look into how consumer behavior shifts when exposed to different volume and pricing adjustment scenarios.

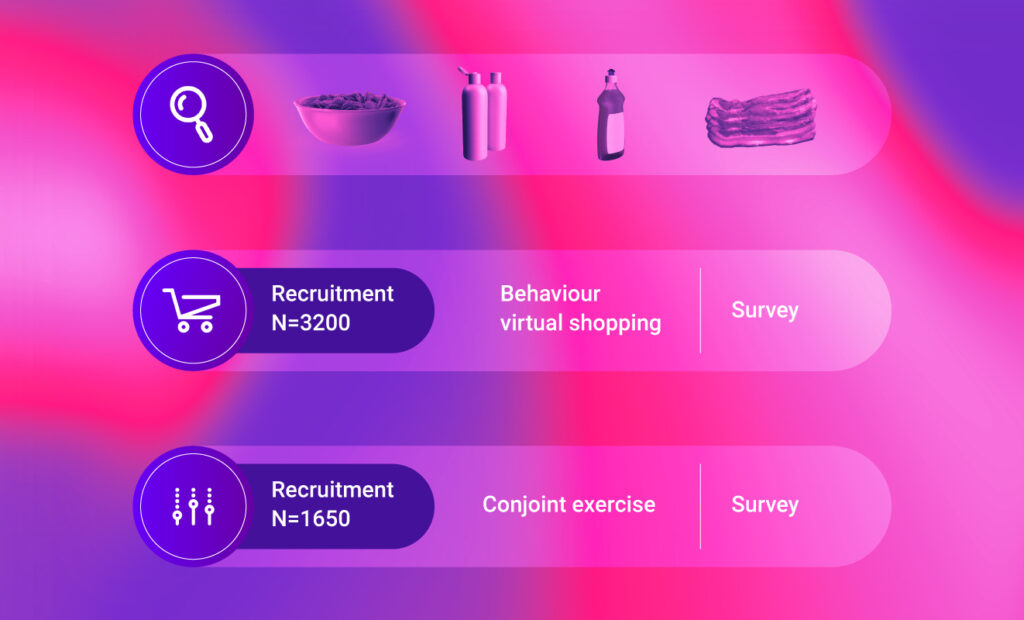
                    This study had two separate exercises (virtual shopping and conjoint) and independent samples going through these exercises to obtain data for four categories.

                    Like last year, we tested two lower frequency categories (body wash and dishwashing) and two higher frequency categories (bacon and chips). And within these exercises, consumers faced different scenarios.

                    In virtual shopping, the participants looked at various scenarios, among them:

                    • a shelf with current pack sizes and current pricing
                    • increased prices on 1/3 of the shelf and the entire shelf
                    • decreased pack size on 1/3 of the shelf and the entire shelf.

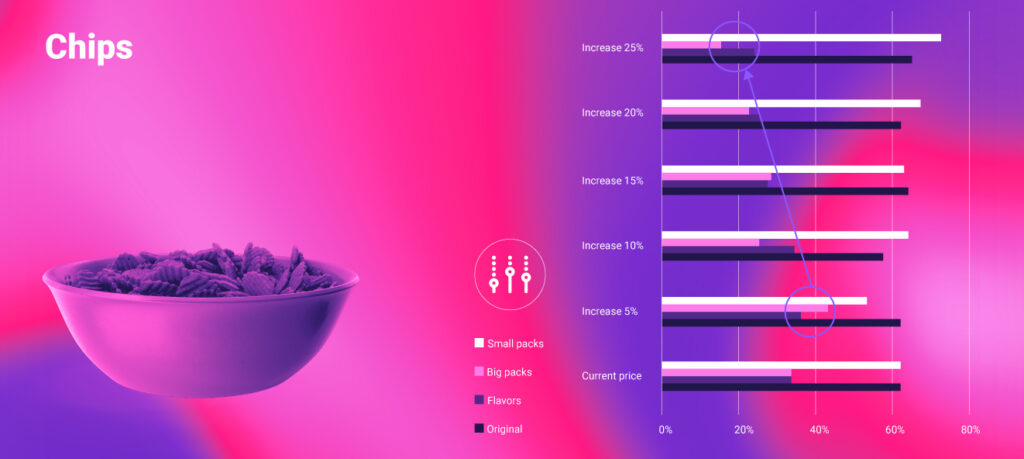
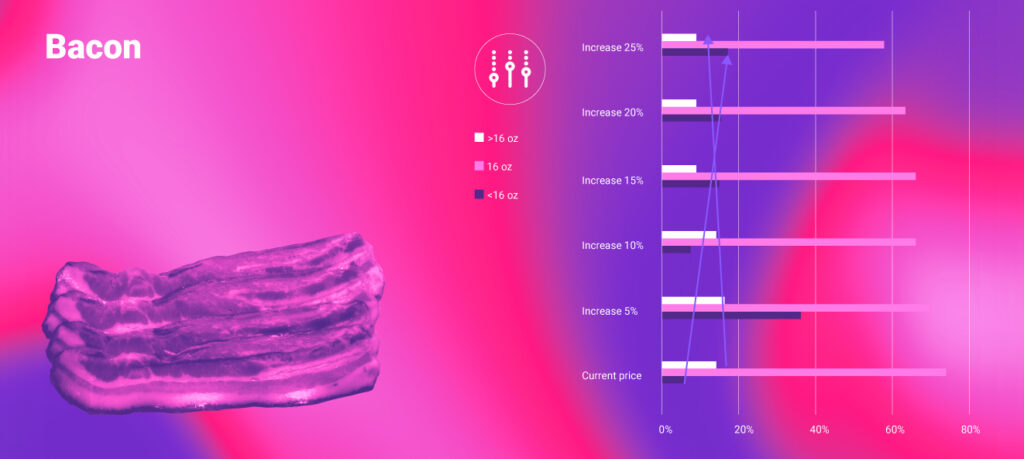
                    In the conjoint exercise, the respondents were faced with different price increase scenarios, as seen on the visual below – from only 5% all the way to a 25% increase, as well as a decrease in pack size.

                    The goal of this study was to look at two possible strategies that brands can opt for – shrinking pack sizes or increasing prices – and how do consumers react to both in the current inflation.

                    Let’s dive deeper into analyzed categories.

                    Original variants of chips and small bags remain stable

                    In this study, we looked at multiple chips variants such as original and flavored, but also big and small packs.

                    Regarding the size of a pack, a shrinking approach does matter and gets noticed – especially so for smaller volume variants. For example, if someone traditionally buys a family size pack, if the volume gets reduced by five chips, it won’t affect them and they are not going to notice that. But if we’re talking about a smaller size pack, even the smaller reduction in volume has a big impact. However, if volume stays the same, and we look at our data, on size choices, we see that people tend to forego big packs at a big price increase, and tend to replace it with a smaller bag of chips.

                    Also, what we noticed right away is that no matter the price increase, the original flavor pretty much remains intact. On the other hand, the same cannot be said for flavored variants that start to take a hit somewhere around a 15% price increase. We can assume that people won’t give up on chips as a basic small pleasure, but special flavors are seen as a luxury in a time when you fall back to your basics.

                    A reactive shift to smaller packs in the body wash category

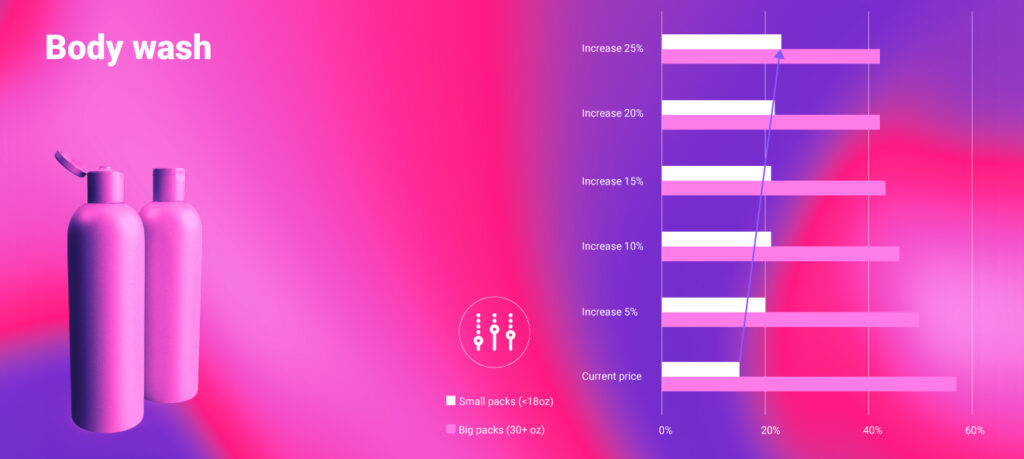
                    When it comes to lower-frequency products, such as body wash, the main data cut we had a chance to investigate is between big packs with 30 oz and more, and small packs with less than 18 oz. And what we noticed is a distinct shift in buying from bigger to smaller packs – notice how white bars continue to decrease with every next price increase scenario while it is vice versa for smaller packs.

                    This shows us that consumers are very sensitive to the current out-of-pocket situation, trying to spend as little as they can, and they often resort to stockpiling as one of the options. As we saw in another segment of the study, people are most likely to stockpile several products such as – canned products, toilet paper, dry pasta and pasta sauces, bottled water, sugar and salt.

                    When does private label win in the dishwashing category?

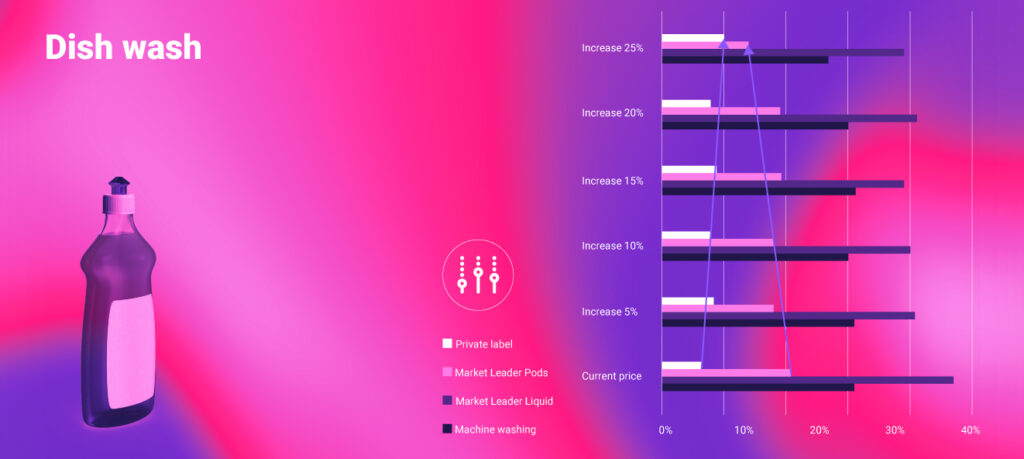
                    At a macro level for dish washing products, we see that the machine-washing subcategory stays stable, similarly to hand washing products. What’s most interesting in this category is the comparison between market leaders and private label brands. The market leader liquid product, although not significant, takes a slight hit at the 5% increase and then stabilizes throughout the other price scenarios. Pods on the other hand, take a more notable hit, especially with a 25% increase scenario.

                    We assume that people go in part to private label pods, which nearly doubles as a choice over different increase scenarios.  We know that approximately one quarter of consumers in the US are reporting that they are purchasing private label brands more often now than they were one year ago, to save money and, and to try to make their budget stretch a little bit further. This is especially true regarding products which are not personal care or indulgence. In our study, we’ve seen that the dish wash is the subcategory where we saw PL benefiting the most – so in these more practical categories, brand loyalty seems to be the least strong.

                    Has bacon reached a price increase threshold?

                    As we all know, in the US bacon plays a larger-than-life role in many consumers’ lives. It’s more than just food to them, it’s a symbol, a feeling, and an experience. So, we were intrigued to see what happened in this category.

                    From the conjoint exercise, we noticed that the biggest packaging options (16 oz and larger) suffer with each price increases how the big bags so suffer to a certain extent. All the while smaller packs see growth with every price increase scenario at the expense of those bigger packs.

                    When it comes to this category, we should also consider the historical per-pound prices. In 2021 and 2022, retail bacon prices have skyrocketed and reached the highest annual average price on record. We must keep that in mind, because those, already increased prices were used as the ‘current’ in our research. Each further price change can be a deal breaker and that’s why we can say that we have probably reached a threshold for acceptable prices of bacon for the average consumer. Customers will just walk away from the category if we increase the price too much more.


                    Interested in more findings from our latest study? Notice the full webinar featuring Heather Graham (Director Client Service @ EyeSee), Sasa Radojevic (Sr Shopper Insight Manager @ EyeSee), and experienced retailer & Awarded 2022 Top Women in Grocery (TWiG) Raina Rusnak.

                      Thanks for your interest!

                      We”ll get back to you promptly