Road to growth: Understanding travel retail consumer behavior

by Koen Philippaerts, New Business Development Manager at EyeSee

I just returned from visiting my family in Europe, and aside from having a nice holiday, I realized that the time I spent waiting on my flight changed my purchasing habits. In the duty-free zone: I found myself wandering around a product category I am not usually interested in, eating lunch when I usually eat breakfast, and purchasing some tech gadgets I did not intend to buy. 

Conde Nast Traveler’s article says that people travel the skies, rails, roads, and seas to tick off major bucket-list moments. So, shifting behavioral patterns and traveling go hand in hand, and a big part of that is the travel retail centers we visit along the way. It is where every journey begins and ends; it is a necessity, but it is also important for travel retail to be convenient, pleasant, and enjoyable.  

So, does it come as a surprise that Statisa predicts that the global travel retail market will reach 174.9 billion US dollars by 2030?

How is travel retail different?  

Travel retail centers are places where consumers are ready to try something new, and brands must be able to give their best and use the opportunity to introduce themselves to new customers, showing their loyal ones that their favorite brand goes where they go. 

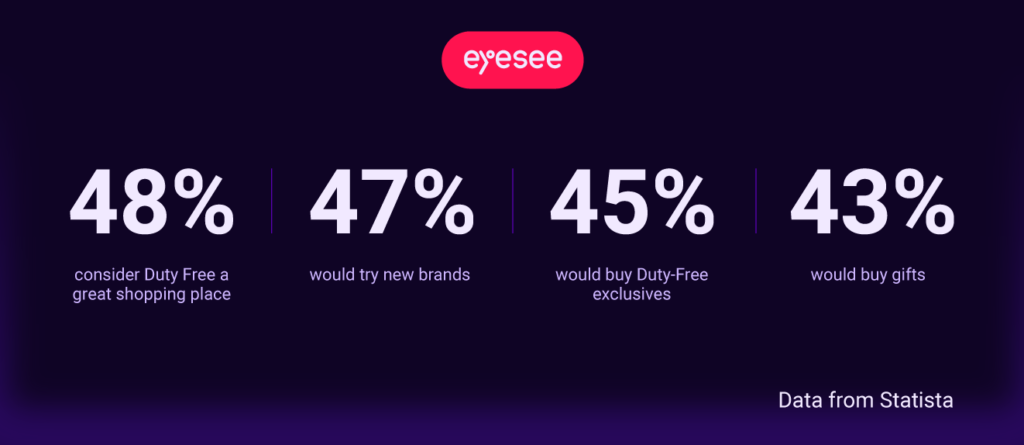
A Statista survey shows that:

  • 48% of travelers think that a variety of products makes Duty Free a great place for shopping  
  • 47% of travelers say it is a great place to try new brands  
  • 45 % are more motivated to buy Duty-Free exclusives  
  • 43 % consider travel retailers a great place to buy gifts  

Unlike standard ones, travel retailers are one of the main distribution channels in the beauty industry (if beauty retailers are put aside). The main categories travel retailers feature are perfume and cosmetics, liquor, confectionery, tobacco, food & beverage, electronics, accessories (bags, watches, eyewear, etc.) 

 When consumers enter the duty-free zone, in most cases, they have some free time on their hands before onboarding starts. Nicely displayed brands will get anyone’s attention, and to be honest, probably some last-minute gift shopping will be part of spending that free time.  Unique display designs can help brands stand out in product displays, as Galvinet Whiskey did when they displayed their bottle as a museum artifact. It was beautifully lit and covered with a protective glass box. All of this was in line with “tradition” as one of their core values: they are Scotland’s oldest legal whiskey distillery. Not only that, from the front of the liquor bottle display stand to the back of the product packaging, the Roman numerals 35 are emphasized. Any Glenlivet enthusiast and collector would instantly know this means a rare bottle of liquor because it’s not in the brand’s collection.   

Graphic solutions are not the only way to shed light on more information in places where people have some extra time to kill. Sometimes that can be shop assistants who engage in further conversation with consumers. If out-of-the-box design solutions and shop assistants handling your brand’s key values sound risky, note that EyeSee has solutions for testing both.  

However, all of this is just the tip of the iceberg when it comes to possible brand touchpoints in travel-type environments. Purchases can be made on planes. There are also all sorts of marketing materials that consumers can pass by: from airplane magazines, brochures, and leaflets to much bigger ATL prints or on-screen ads. The possibilities are endless!

What can we learn from travel retail? 

There are many types of point of sales displays: 

  • Counter displays  
  • Free-standing display units  
  • Product displayed quickly units  
  • Light boxes  
  • Gravity feed display units  

The creative potential of these displays is limitless. Recall the enormous cardboard fence constructed from KitKat bars and the point-of-sale box brimming with an abundance of KitKats, a temptation to dive into. And the best thing about it is that it would work not only for travel retailers but in supermarkets too. 

Over the last couple of years, the market research industry has seen a steady rise in online context testing solutions such as virtual stores, which offer cost-efficient and fast findings but also boast very high validity. Apart from providing stable results even in changed circumstances, Virtual shopping has a very high correlation with real shopping behavior – as much as 0.8-0.9.   

EyeSee’s in-house design capabilities enable the customization of any type of virtual shopping environment. Furthermore, a multitude of pre-built, standardized shelves are already accessible across over 80 categories. State-of-the-art graphic solutions can be designed in 2D, 2.5D, and 3D models and provide high levels of consumer immersion that help produce authentic insights.

In conclusion  

Understanding consumer behavior in travel retail serves as a valuable compass for brands seeking inspired growth. The unique environment of duty-free zones, characterized by ample free time and consumer openness, offers an exceptional opportunity for brands to engage and leave a lasting impression.

Brands that understand and leverage these unconventional retail rules stand to unlock untapped potential and navigate non-standard points of sale successfully.  As the market research industry embraces virtual shopping solutions like EyeSee’s, the prospect of testing concepts and display designs becomes more efficient, cost-effective, and aligned with real shopping behavior, emphasizing the importance of staying ahead in an evolving consumer landscape. 


Are you eager to know more? Read Everything you didn’t know about the design of in-store displays.

    Universal Robina x EyeSee: the secret to a successful TikTok campaign  

    By  Xinyu Tok, Senior Insights Manager.

    In the previous article, we already stressed the strong impact that TikTok has on consumer purchase decisions as well as the reach that sponsored content can have if done properly.    

    The figures speak for themselves:   

    • 71% of TikTok users stop and watch the first three seconds of the video 
    • 56% of each sponsored piece of content is seen on average 
    • 73% of TikTok users like the ads that they see  

     As we explained, we tested 60 ads from 20 brands across markets and industries such as FMCG (Fast Moving Consumer Goods), Beauty, Insurance, Fashion, Technology, Automotive, Retail, etc. TikTok simulations, standalone ads, and surveys were tested among 7280 respondents. All of the respondents were TikTok regulars who had purchased items from some of the categories in the previous six months. You can request the study walk-through at [email protected]

    Universal Robina is a great study example since their FMCG portfolio is impressive, and they turned out to be one of the winners in the game of TikTok. Let us take a closer look at the testing process and the outcomes.

    What works better: native versus heavily branded approach

    When it comes to ad style, brands typically choose between two options. They either create a single video and distribute it across all platforms, even though each platform has its own set of rules, or they assume that the native approach will win. Of course, creating a single video for multiple platforms is more cost-effective, but the native approach yields better results on a specific platform. However, both of those theories have their ups and downs, and the key is to test them, preferably in a simulated digital environment. By using natural and unforced exposure of the stimuli in an environment as close to reality as possible, we get an objective and accurate insight into the actual ad visibility.  

    In the TikTok simulation, respondents saw three videos: an advertisement for Great Taste, Cloud Nine, and Jack’n’Jill. We also consider the focus (time spent on the screen), retention (percentage of people who watched the video), and stopping power (percentage of people who stopped to watch the video) of tested ads.  

    Great Taste and Cloud Nine ads performed better than Jack’n’Jill in terms of focus, with 8.6s vs 7s; however, because Jack’N’Jill used a more native organic approach, it performed better in terms of retention and stopping power. (77% vs 57% and 86% vs 74%).

    But does this necessarily imply that Jack’N’Jill performed better in terms of brand visibility? Not necessarily. With the organic approach, there is always the risk that the video will be insufficiently informative and that the key message will be missed.

    What prompts TikTokers to recall brands more?  

    It is important to note that not only are all three tested stimuli different in style, but they also place the product in a different place in the timeline. Great Taste and Cloud Nine commercials have great dynamics and upbeat music, and the Jack’N’Jill approach is more raw and native; however, both approaches scored good brand recall, with only 2% of the difference in favor of Jack’N’Jill (74% vs. 72%).   The key finding, however, is that watching the entire video increases brand recall by 35% compared to viewing only half of it. 

    Key findings  

    Universal Robina ads performed extremely well, so one of the key takeaways is that they should maintain TikTok content style while also maintaining their core brand attributes. They succeed in keeping users’ attention by using upbeat music and video dynamics, and they get their message across.

    Oversimplification of the video should therefore be avoided. Because user attention is difficult to maintain, quick changes of scenery rather than just one setting are preferable. And, as previously stated, a native approach is not without risks, so whether it is appropriate for your brand depends on the strategy and campaign goals.

    However, to see the full results of the Universal Robina study and to learn more about post-pandemic shoppers, watch the video below. There you will find the full presentation that debuted at the Asia Research Breakfast, which we were fortunate to attend as guest speakers. Also, don’t forget to acquire the whole study walk-through at [email protected]


    Interested in reading more about global TikTok study? Click here.

      Tap into hidden potential with new TikTok creative insights

      TikTok is an undeniably influential social media platform with significant untapped potential for sponsored content. Following the pandemic, our habit of using TikTok remained strong. The app enjoys one of the highest user retention rates globally. An incredible 81% of users say TikTok videos influenced their recent purchases. That is why it is becoming increasingly important for brands to understand how to create effective ads that resonate with their consumers.  

      According to our most recent two-wave global study, we discovered that 71% of TikTok users stop and watch the first three seconds of the video and that 56% of each sponsored content is seen on average. All of this is supported by the fact that the ads are liked by 73% of TikTok users.

      These figures show that sponsored content has every reason to thrive in TikTok’s digital environment. However, brands are still not using their full potential. This study not only invites you to use TikTok to empower your brand, but it also gets deep into what you must keep in mind while doing so. If you are interested in getting an expert walkthrough of the study, write us at [email protected]  

      Methodology

      As previously stated, we tested 60 ads from 20 brands across markets and industries such as FMCG (Fast Moving Consumer Goods), Beauty, Insurance, Fashion, Technology, Automotive, Retail, etc. TikTok simulations, standalone ads, and surveys were tested among 7280 respondents. 


      This research is built on the following key pillars:    

      • Ad stopping power (tested the ads in a simulated TikTok environment that provided us with browsing insights)    
      • Ad retention (tasted by exposing respondents to a simulated TikTok environment)    
      • Ad emotional reach (tasted by exposing respondents to standalone ads and utilizing face coding methodology)    
      • Ad likability (tasted by exposing respondents to standalone ads and utilizing face coding methodology)    
      • Brand recalling (to learn % of respondents who remember seeing the advertised brand when prompted, we used the survey method) 

      The challenge of TikTok advertising

      Why don’t brands use TikTok more? This is the imposing question that arises when we look at the numbers that show the untapped potential. On one hand, we have the answer that for brand managers, it is hard to follow the ROI once they invest in TikTok ads. They are unsure how to follow the path and make a clear connection, or better to say, they are unsure how to follow the path to purchase from the TikTok ad to the shopping cart. 

       On the other hand, even when clarity in that field is gained, the questions of how to approach strategy and what works best remain. There are questions about what will work better – the native approach or strongly branded videos that will also work on other platforms; what is the reach of animation as the dominant style; and is co-branding the way to more followers and engagement or the way to poor brand recollection? 

      This study answers all those questions and beyond. For example, animated video ads, those containing any kind of computer-generated imagery, will improve brand opinion by 23% and increase brand interest by 19%, while elevating the positive emotions about the brand by 20%.  

      However, brands must be careful; there is a chance that they will be seen as less informative than conventional videos if the message and narrative in them are not constructed carefully.  

      The golden rule for unlocking the untapped potential 

      What is great about this report is that it contains a lot of simple facts that must be considered in future ad planning. For example:   

      • If the ad lasts up to 10 seconds, it has a 71% higher chance of being fully viewed.  
      • A video that lasts up to 10 seconds has a 38% higher chance of being liked.  
      • If the brand lasts up to 10 seconds, it has a 15% better chance of being remembered.  

      This is an example of an insight finding that makes a strong recommendation that is universal around the world. However, in this report, there are far more complex recommendations that necessitate a thorough examination of both specific brand values and the TikTok environment. 

      All of this is only the beginning. If you want to learn more, send an email to [email protected] and we will provide you with a video expert walkthrough of the study. Not only will you get the big picture and the future framework for making strategic TikTok ad planning decisions, but you will also be able to formulate specific questions for your specific pain points, which we will gladly assist you with.  

      Request access to

      TikTok creative study findings!


      Eager for more? Read the blog about replicated feeds for authentic behavior here.

        Worldwide consumer behavior: 4 different perspectives

        We learned a lot about the shift in consumer behavior after the pandemic and during inflation from a recent meta-analysis study conducted by EyeSee. However, different perspectives shed light on different challenges and opportunities. EyeSee excels in connecting and scaling global knowledge since it operates in 50+ territories, constantly accumulating insights through deep behavioral analysis in a wide range of industries.  

        Our data, insights and business experts, all of whom came from different places, told us how they see consumer behavior changing, what kind of innovation they hope for, and what their predictions for 2024 are.  

        Perspective #1: APAC aims that traditional beauty ingredients become global trend 

        Xinyu Tok, Senior Insights Manager, APAC 

        We’re a diverse market with varying external influences that shape our choices. 

        The rising costs of living and inflationary pressures are global phenomena that we’re also exposed to. 

        Yet, the recent COVID crisis has also brought the need for self-care practices to the fore—one that encompasses emotional, mental, and physiological care. 

        As a self-care advocate and a researcher working a lot in the beauty industry, what makes me excited is to see how brands can connect these phenomena to offer us affordable luxuries in the beauty and personal care space. 

        Particular to Asia is also our usage of traditional skincare ingredients that vary across the different cultures here. This offers a rich playing field for brands to provide beauty seekers here with a modern take on natural, wellness-inspired beauty products. For instance, Bakuchiol (used in traditional ayurvedic treatments) arose as an alternative to the popular retinol. 

        In 2024 and the years to come, I would love to see how ingredients used in traditional Asian skincare treatments would be recognized and amass greater mainstream popularity. 

        Perspective #2: LATAM is all about brand-alliances and cross-selling 

        Victor Olivares, Internal Business Development Consultant at EyeSee, LATAM 

        I think brand loyalty is being tested since incomes at home are not enough due to the crisis; people might be switching to cheaper brands or avoiding certain expenses while at the same time spending money on entertainment because of COVID-19 post-lockdown. In markets where the economy is more unstable, things are getting much harder. 

        There are new flavors in the FMCG category (biscuits, chips, sodas), including brand alliances and the usage of brand licenses for cross-selling, but as a movie fan, the ones I have my eyes on are the new popcorn flavors in cinemas. 

        It’s hard to pick one future trend because there are a lot of trends lately: eco-friendly products, light/zero sugar versions of some things, but I think consumer experience will become more relevant, so I think we will see a lot of “memory makers” (people making up for the “lost” time and trying to document every moment) reconnecting with things, trying to be heard and seen. 

        Perspective #3: Sustainability is still strong trend in EUROPE 

        Nicole Tudosie, Business Development Director at EyeSee, EUROPE 

        Given this is a global crisis, we in Europe are also strongly affected by the effects of soaring inflation, and with mortgage payments starting to go up for many, shoppers’ disposable income is being squeezed. 

        In the UK specifically, food has seen some of the highest levels of inflation and considering 86% of people are looking to improve their health, it’s a struggle to do so when these items are usually more expensive. 

        I think the biggest area of innovation will continue to be sustainability, and I’ve seen some great recent examples, like Penny in Germany launching a ‘true cost’ campaign to raise awareness of the environmental price of producing food; or rolling out our digital screens and labels to reduce waste in stores. 

        Sustainability, as we saw with Penny, will continue to be important for consumers, and therefore innovation is needed here. 

        I’m very excited to see what role AI will play in CPG next year! I recently saw that Migros launched the world’s first AI-created drink, where ChatGPT generated the recipe based on recent trends, and the packaging was created by another AI tool called Midjourney. Where next? 

        Perspective #4: USA consumer confidence and optimism is coming back 

        Jason Bradbury, Sr. Director Client Service 

        Despite a difficult economic climate right now in the US which continues to be shrouded in uncertainty, consumer confidence and optimism is slowly improving relative to where it was just a year ago.  Consumer spending remains strong, however, they are more cautious about how and where they spend their money.   A spending paradox has emerged…  On one hand, consumers are making more choiceful purchase decisions – in some cases seeking greater value by trading down to less expensive store-brand items to maximize their spending power.   Despite this, there is a clear openness to splurge – to treat oneself by paying premium prices for higher-quality products or those that are driven by spontaneous cravings.   

        I am excited to see the unique products that emerge following the sale and acquisition of several CPG firms that took place in 2023 and the strong desire by key companies to create news within their respective categories (blending brands, blending product benefits, and core product equities into new products). Companies are constantly looking to expand their offerings to attract new customers, and I think the competition in the industry right now may help to inspire new innovative creativity that will drive unique products to market.    

        I think, we are going to see a major boom in social commerce spending – particularly on TikTok.  Social media has emerged as a powerful platform for driving product discovery and promoting ecommerce. In 2023 we saw brands registering success with TikTok ad campaigns and I suspect that in 2024 we will see a major surge as many others follow suit.  With so many younger consumers using TikTok to discover, research, and offer their impressions on products, I foresee that TikTok will naturally become a more relevant part of their shopping process. 

        Every territory and every market has its own rules, but maybe it is exactly in the differences between the untapped opportunities lie. It is not uncommon for local trends to become global and vice versa, so keeping your eyes on all four sides of the world is strongly recommended. 


        Interested in diving deeper into consumer behavior knowledge, tune in and follow our podcast you can acquire here.

          Behavioral insights: Backbone of successful co-branding initiatives

          Written by Jason Bradbury, Sr. Director of Client Service at EyeSee

          I am a simple individual and perhaps a creature of habit – choosing peanut M&Ms as my go-to sweet snack, relying on Cinnabon k-cups for my daily coffee fix and letting Apple technology keep me well-organized and connected.

          While data (and life) confirm I am not a lone example of a consumer having favorite brands, recent research shows that these loyalties are first to go as we adjust to the mounting pressures of the global recession. Apart from tinkering with variables of pricing and volume, there are other strategies your brand might explore to preempt eroding loyalty.

          In fact, there’s a good chance one of your new favorite products may just be the result of two separate brands working together – the fruit of a co-branding or licensed partnership initiative. If your goals for 2023 include:

          • Reconnecting with or Expanding your consumer base;
          • Evolving your brand identity or reputation;
          • Innovating the product;
          • And/or all the above…

          …then co-branding may be the right strategy for you! However, this approach does carry certain risks and mitigating them should be a top priority. Here’s how behavioral research can help.  

          Know your shifting consumer and (re-frame) their needs

          75% of brands could disappear tomorrow … and most consumers wouldn’t care. On top of this, shoppers are already actively engaging in brand-switching behavior due to rising inflation. By exploring collaborations within or across categories, you are opening a whole world of possibilities to either deepen the connection with existing consumers or to expand your base.  

          Well-known consumer products entering into a partnership with Disney is one such example.   Disney-licensed characters are displayed on Huggies diapers, Band-Aid adhesive bandages and even Gucci collections! Disney characters are iconic, instantly recognizable, and intergenerational.  Through these collaborations, these brands have managed to overcome their challenges in creating appeal and eliciting an emotional response, which has an enduring effect on retaining brand loyalty but also helps draw consideration among new potential customers.

          The journey of successful co-branding begins with understanding the intersection of consumers and their behaviors. Pre-testing your advertising materials (online videos, TVC, social media posts, etc.) and packs can give you crucial insight into how consumers will see, react, evaluate, and if they would ultimately be inspired to purchase your co-branded product. A mixed-method approach, where behavioral methods of eye tracking, facial coding and virtual shopping are combined with surveys, can measure such preferences with as much as an 80% correlation with actual shopping behavior.

          Introduce agile reality-checks to your co-branding initiative

          On average, less than 20% of product and pack innovations prove to be a success. Adopting an iterative approach and testing at each step of development increases the chances of yielding a positive result.

          More specifically, there are 3 main points where behavioral research can play a big part in shaping your co-branding initiative:

          • Screening: start testing early in the process (even concepts and drafts!) and narrow down your options. Leverage more granular sub-category criteria, including usage frequency, understanding brand awareness and openness to purchasing the product, and even filtering on geolocation. With every added testing criterion, the potential risk of a new launch gets smaller.
          • Test in context: use virtual simulations of stores and retail environments to tap into authentic consumer behavior with high accuracy. The same goes for e-commerce – any website or webpage, such as Amazon, Target, Kroger can be replicated. Having the ability and agility to put respondents in a context that feels familiar and authentic is key in estimating the success of the co-branding strategy.
          • Volumetric and Market share projection: test claims, pricing, and other aspects of launch to estimate in-market success, switching behavior and opportunities for driving share within the first year.

          Make co-branding resonate: Optimize at every touchpoint

          Experts concur that having a seamless and experience-driven path to purchase is more important now than ever. Shoppers’ expectations are changing – and brands must be aware of the hyper-sensitivity of their customers. Thus, co-branding can be an effective tool to not only enhance brand or product communication, but could also serve as a potential visual cue for highlighting variety or sub-line differences.

          Additionally, there are many widely overlooked opportunities within omnichannel – optimizing touch points such as e-commerce pack shots being one of them. Hero images can significantly boost sales by attracting more attention. They garner 5% higher visibility than Standard Package Designs on desktop (with even greater potential on mobile because of the smaller screen size) and can increase sales by about 15%. Considering these key touchpoints when implementing a co-branding strategy can significantly boost your chances of success.

          Summary

          Co-branding is all about expanding opportunities to connect viscerally with the consumer. By introducing new propositions and potentially enhancing communication by leveraging the established equities of each brand, you are generating broader interest and/or emotional response, which has a positive effect on consumer retention.

          Adopting behavioral methods and testing within contextual shopping environments allows more authentic and predictive insight into how your co-branded product will perform. This type of feedback minimizes the risk of unfruitful investment and represents a definite advantage – even more so under the pressures of recession, where consumers are increasingly fickle and marketing budgets precious.

            Capture their attention first, and the ‘heart’ next: attention & emotions in social media advertising

            Written by Vanja Radic, Facial Coding Team Lead at EyeSee.

            Many of our clients have asked what a successful social media campaign entails. In this article, we will address the most important creative aspects to have in mind when directing and optimizing social media ads. Those aspects revolve around two main pillars: attention management and emotional engagement.

            TVC vs. social media

            Although attention metrics can always provide additional insights, they are not essential when it comes to TVC testing; as for this advertising format, some amount of attention comes as a given – the TV is on, and we just move on to other activities until the TVC clutter dissipates. A lower level of attention is even considered a unique TVC advantage, allowing a more subliminal persuasion to take place (Heath, Robert). Countless academic discussions address the pros and cons of TVCs vs. social media advertising, however, when it comes to a younger and more specific target audience, social media marketing is without a doubt winning the game. Nevertheless, social media as an environment poses additional challenges when it comes to creating a successful video ad. Ferociously fast-moving timelines have brought on the need for marketers to become excellent managers of attention. Consequently, attention metrics come into play as the strongest indicator of success: being three times more predictive than viewability, attention metrics inform marketers about how much of the video content will actually be seen.

            Let’s introduce an analogy: the difference between seeing a movie cover and seeing the whole movie or a part of it aptly illustrates the difference between viewability and attention. Unfortunately, most social media analytics limit themselves to viewability, in that way stunting the learnings from past campaigns.

            Yet, it’s important to note that testing an ad only on attention metrics doesn’t give a full picture of its performance and therefore limits the feedback on where the spaces for improvement lies. Attention metrics represent only one side of the coin since they say nothing about a very important driver of attention and consumer behavior overall – emotions.

            Attention vs. emotions

            It’s difficult to talk about attention without appreciating emotions since they can critically modulate attentional processes and, at the same time, increase the likelihood that an emotional experience becomes part of our memory store; in turn, creating an emotional connection to the brand.

            “A marketing strategy focused on appealing to consumers’ raw and most personal emotions can change a faceless, perhaps seemingly soulless, business into a brand that audiences can relate to and care about.” (Ingwer, Mark)

            We are constantly bombarded by a plethora of information and experiences, only a small subset of which will be encoded into lasting memories. That small subset that is likely to be selected from the barrage of information is the emotional content. Apart from transforming experience into a memory, emotions powerfully, predictably, and pervasively influence our decision-making, which is why brands should make sure their advertising efforts elicit positive emotions.

            The best way to access the emotional quality of an ad is by applying the Facial Coding method. As both appealing to emotions and managing attention are equally important, EyeSee’s methodology relies on both facial coding and attention measurement when assessing an ad’s performance on social media.

            How we do it

            Nothing better than an example to illustrate the complementarity and uniqueness of these two methods. Here are the results from a YT ad testing study, summarized in Retention rate per second (Attention) and Emotional engagement per second (Facial Coding) graphics. 

            A look at attention measurements for this ad shows that the retention rate drops below the benchmark from the moment the skip button appears. This drop severely influences other attention metrics, like competition rate and overall focus, as the viewers who click the skip button are irreversibly gone (the line can only go down). Still, we can see that there is a shift in the 7th second, where the line starts to straighten, from that moment on, floating above the benchmark. 

            Graph 1 Retention rate per second (Attention)

            Now let’s consult the emotional metrics provided by Facial Coding:

            Graph 2Emotional engagement per second (Facial Coding)

            From the standpoint of facial coding, the ad is a high performer, reaching a 20% positive tipping point in the 11th second. Obviously, humorous scenes developing from the 7th second have done their part in positively engaging viewers’ emotions and need no further script-based modifications. If we go back to the Retention rate graphic (Graph 1), we cannot help but notice how emotions interfere with the attentional processes – i.e. attention drop-off decreases from the same moment that stimulus starts to engage the viewers. However, if we were limited to attention measurement metrics only, we might be tempted to wrongly assess this social media ad as an average-to-low performer; nevertheless, Facial Coding demonstrates its strength and potential in engaging positive emotions, hence sharpening the feedback given. Therefore, by combining both attention measurement and facial coding, we can say for certain that the biggest space for improvement lies in the first part of the stimulus; this is probably due to a lack of suspense or dynamic shift around the 5th second, that second being the stumbling stone for effective attention management in the YT environment.

            Insights into social media ad performance can be even more enriched by supporting these two methods with other behavioral methods such as Eye Tracking, Virtual Shopping and Reaction Time Measurement. Given that Facial Coding yields data on how the respondents feel when exposed to an ad, Eye Tracking is utilized to pinpoint what exactly they are looking at when watching the video, uncovering the main areas of interest. And while an ad can be both entertaining and attention-grabbing for consumers, generally excelling from the creative side – the question of what it brings to the brand remains open. That is where Virtual Shopping comes into play, enabling us to measure the actual impact on sales, whereas Reaction Time Measurement ensures we understand the impact on the brand itself.

            Conclusion

            Relying solely on attention metrics in social media testing is not enough if we really want to learn from past experience and squeeze the most out of the input available. By applying the right combination of EyeSee’s behavioral methods, we can understand both the emotional and attention aspects of video content, which allows us to pinpoint exactly where space for improvement lies. 

            If understood and excavated properly, emotions can be powerful commercial tools and many brands have come to the conclusion that appealing not only to consumers’ reason and logic but also to their heartstrings can give them a competitive advantage. Besides establishing attention as an adequately managed KPI, Facial Coding method helps marketers ensure that their advertising efforts are successfully connecting with their audiences emotionally.

            Heath, Robert. (2012). Seducing the subconscious: The psychology of emotional influence in advertising. Wiley-Blackwell.

            Ingwer, Mark. (2012). Empathetic marketing: How to satisfy the 6 core emotional needs of your customers. Palgrave Macmillan.

            Advertising Week: Attention is the New Metric

              Want to go viral? Use facial coding!

              Although billions are invested in online video advertising, an accurate methodology for predicting whether an online video ad will achieve its viral objective on social media has not yet been developed. With a grant received from the European Commission, EyeSee conducted an online video study among more than 1500 respondents. Each respondent watched five online videos, followed by a survey.

              We found that facial coding is two times more efficient in predicting its potential to go viral, as opposed to the use of a more traditional method, like a survey.

              The study: 1539 respondents were exposed to 52 online commercials of the biggest brands

              The goal of the study was to determine if a facial coding interview and/or a survey can predict the viral effect of online commercials and what their impact is on sales.

              • 52 online commercials from seven industries were tested. For each industry, we selected the two to three leading companies. For each company we chose one best-performing and one least-performing online commercial, based on number of views, shares, likes and comments on YouTube and social networks.
              • In total, 1539 respondents were recruited. Respondents were first exposed to two to five ads while their emotions were tracked through facial coding. Afterwards, respondents were asked to fill out a survey.
              • A two-staged process was used for emotion recognition. First an algo automatically detected the respondents’ facial expressions, next, a human coder double-checked the coding. The expressions were coded into 7 emotions: happy, surprised, disgusted, puzzled, afraid, sad and neutral.

              Research results

                 1. Facial coding: explains the viral effect two times better than traditional survey

              Using facial coding, the facial expressions evoked by the commercial were translated into seven expressions. The study found that surveys explain 23% of viral effect of online commercials, while facial coding explains 45%. Thus, facial coding can predict the viral performance much better than surveys and therefore can keep marketers from investing into future failures.

              In general, more than half (53%) of viewers have an emotional response to the commercials from our top viral category (>5000 viral activities), compared to around a third for the low viral category videos (<500 viral activities).

              2. Facial coding: Happiness is the best predictor of viral activities

              Of the seven coded emotions, only happiness was found to have a significant correlation with viral activities, meaning that only when people feel happy while seeing the advertisement, will they be more likely to share, like, and comment on social networks

              42% of respondents expressed happiness while watching videos with more than 5000 viral activities. This result makes it the most often expressed emotion. A further 12-14% of respondents were puzzled, while 9% were surprised while watching the commercials.

              The graph below shows a clear correlation between expression of happiness and viral activities (number of shares, likes and comments on and social networks).

              As for the brand awareness: the situation when respondents are happy, but not confused, results in the commercial being remembered.

              3.  Survey: Non-relaxing commercials have the highest chance to get viral

              The survey is based on the combination of widely accepted pre-testing TV commercial surveys and consists of seven dimensions:

              • Enjoyment – likeability and emotional attributes (pleasant/unpleasant)
              • Involvement – emotional attributes (interesting/boring, relaxing/irritating)
              • Branding – brand connection
              • Newsworthiness of content – was it new, relevant, credible, different?
              • Understanding the message – was it easy/hard to understand?
              • Brand perception – is the brand perceived differently, better or more appealing after seeing the               commercial? What is the level of brand consideration?

              Also, important variables were if they would share the video online, or buy the product.

              Among all tested survey variables, three of them are significant predictors of the viral effect:

              1.       If the content is perceived as distinctive,

              2.       If the content is NOT perceived as relaxing,

              3.       If respondents state they want to share it.

              Distinctiveness of the content is the most important survey attribute and in the highest amount predicts future viral effect as can be seen in the following graph.

              Remaining results to be revealed: facial coding of online commercials as sales predictor

              ·         Whether facial coding of commercials can predict the impact on sales,

              ·         If socio/demographic differences affect a commercial’s online success – who is more expressive/what is the key factor that drives attention: woman vs. man, buyers vs. non-buyers, younger vs. older…

              Stay tuned…

                  Thanks for your interest!

                  We”ll get back to you promptly