Early Quant Screening Research for a Winning Edge 

By Cliff Kane, Senior Director, New Business Development @ EyeSee 

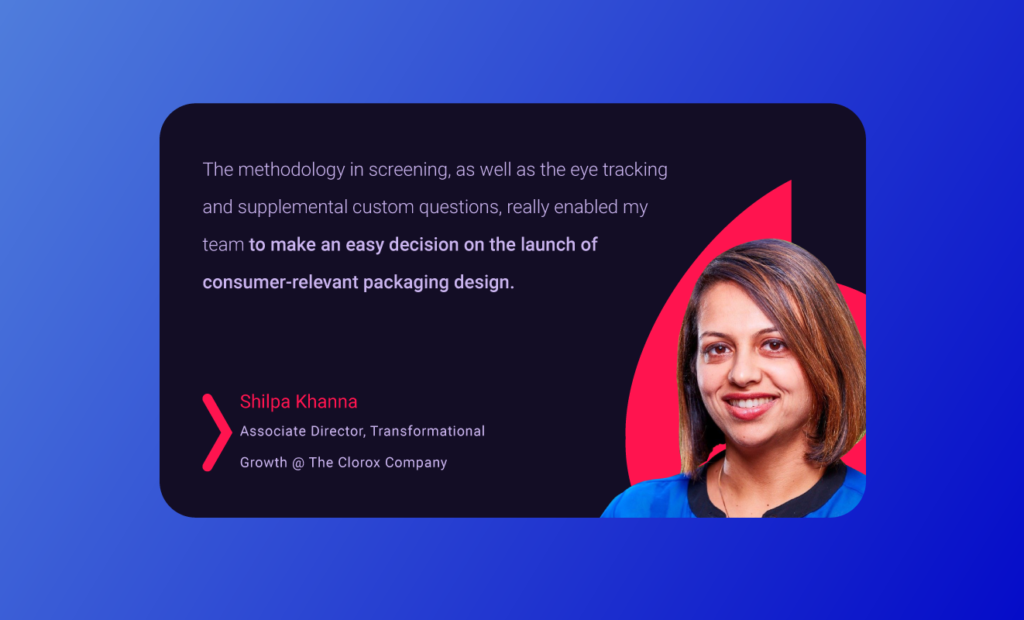
At the recent Quirk’s Chicago conference, I had the pleasure of sharing the stage with Shilpa Khanna, Associate Director of Transformational Growth at The Clorox Company. Shilpa’s extensive experience and unwavering dedication to innovation within the CPG industry positioned her as the ideal expert to discuss the do’s and don’ts of launching new products. Our primary aim was to demonstrate effective strategies for building confidence in new packaging decisions and launches. Our discussion covered: 

  • The symbiotic relationship between quantitative and qualitative insights. 
  • The pivotal advantages of early packaging tests compared to delayed evaluations. 
  • The indispensable significance of testing within the context of simulated in-store scenarios, rather than solely in isolation. 

In this blog post, I’ll take a closer look at key insights. For a comprehensive understanding, I highly encourage you to watch the full session recording.

The symbiotic relationship between quantitative and qualitative insights  

Let’s face it – innovation is tricky.  

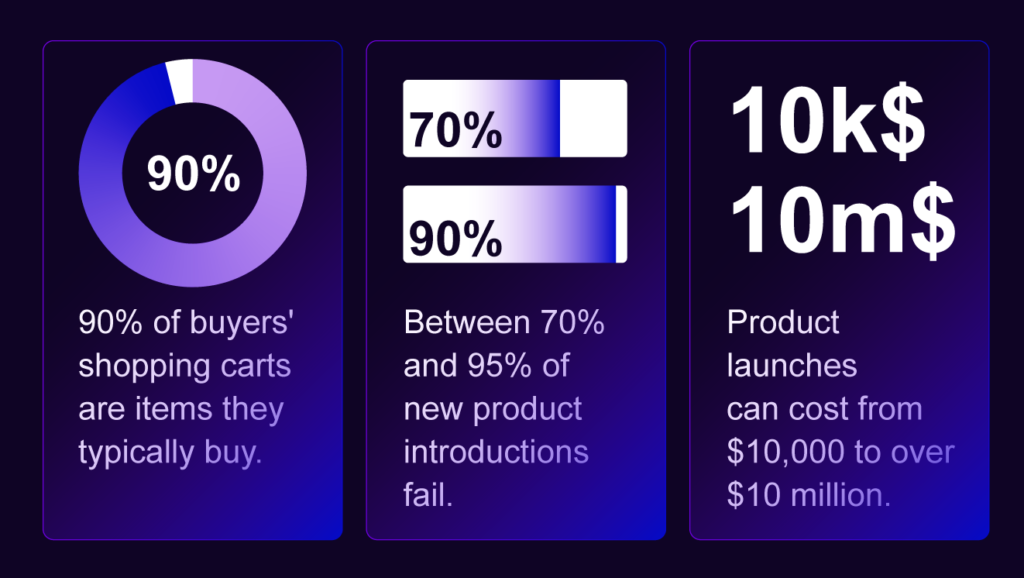
Within the highly dynamic and complex process of product development, packaging design serves as a linchpin for consumer engagement and purchasing decisions. Getting the packaging just right can be costly, as visually communicating a new-to-market proposition carries certain risks and requires alignment with ever-evolving consumer preferences.  

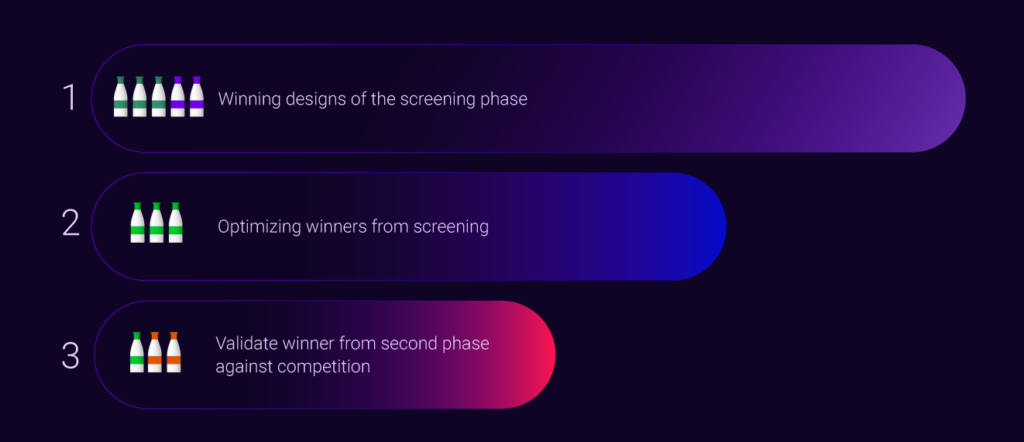
Traditional pack development often advises starting with qualitative studies to evaluate a range of design options, followed by quantitative research to validate a few “finalist” ones. However, the initial screening phase is critical. It’s like choosing the right path in a forest; if you go wrong at the start, subsequent adjustments matter little. So, objective assessments of what drives success are vital from the beginning. Starting with quantitative research to identify winning concepts enables refinement and validation, laying a strong foundation for success.

Advantages of early packaging tests compared to delayed evaluations  

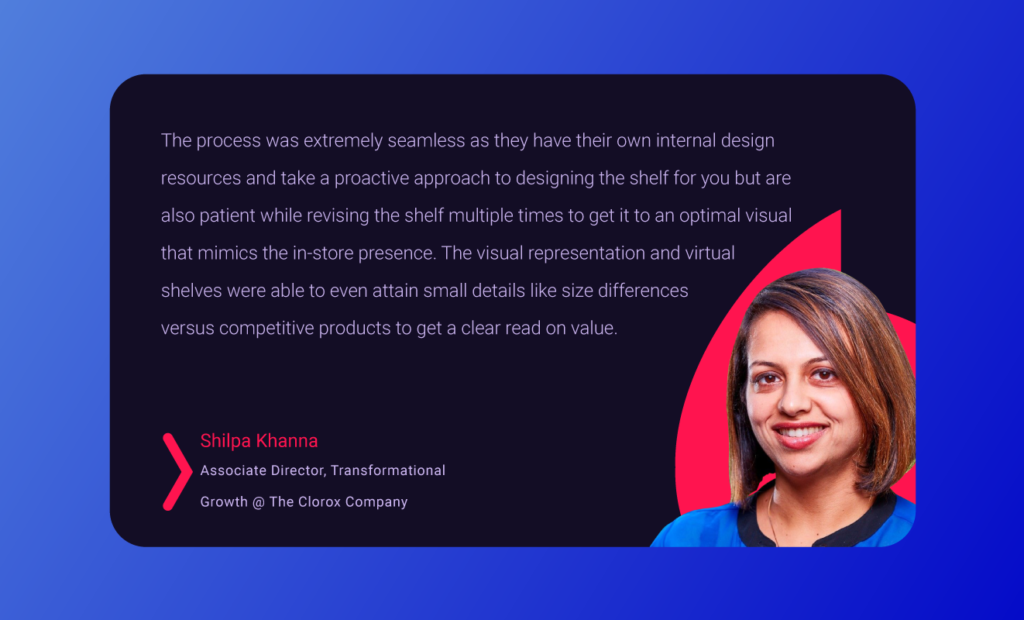
In the overall product development process, packaging is often perceived as the final embellishment to an exceptional product. In reality, it serves as the enticing red door that captures consumer attention, drawing them in to explore and engage with the product experience. Therefore, packaging development and assessment should occur in tandem with the core product, ideally at the earliest stages of development. During our conversation, Shilpa strongly emphasized the necessity of proactive pack design testing, serving as a guiding light to inform strategic decisions and mitigate risks: 

Amid the array of early-stage testing options — from traditional qualitative studies to a multitude of DIY and AI tools — making a methodology choice can be daunting. Personally, I find the behavioral mix approach, incorporating MaxDiff analysis, particularly promising for yielding effective results. At EyeSee, our team employs this method to pinpoint winners, offer recommendations for optimizing successful packs further, and contribute to finalizing subsequent iterations of pack design. 

The ultimate reality check: Testing designs in simulated in-store scenarios vs in isolation

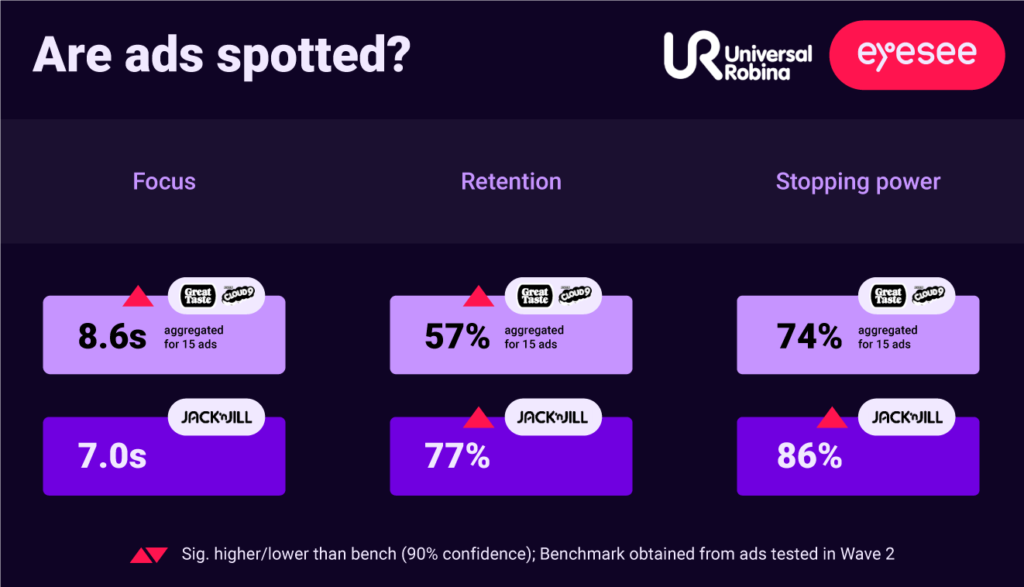
During our discussion on innovation, Shilpa mentioned one new product launch case that stood out as particularly intriguing. Initially, packs featuring a unique cap color and shape emerged victorious in early-stage and standalone assessments. However, when introduced onto (virtual) shelves and compared with others in the category, the tide had turned. A completely different design was ultimately picked for launch.  

Centering on the importance of context, we explored the perspective of the challenger within the category. The “newcomer” on the shelf must distinguish itself more prominently to compete with the leader. The harsh truth is – what doesn’t stand out has little chance of being purchased. The evaluation of Clorox’s late-stage packs would have yielded vastly different results without testing in the shelf context. The intricacies of the store and real-life purchasing environments provide the most authentic and predictive insights into how the pack will perform post-launch. Reflecting on the whole collaboration, Shilpa shared: 

In conclusion

Innovation in early-stage packaging design testing requires a delicate balance of collaboration, creativity, and strategic vision. By redefining conventional approaches, leveraging data-driven insights, and prioritizing consumer-centric design, you can instill confidence and enhance the prospects of a successful new pack launch. Moreover, the importance of testing within simulated in-store scenarios cannot be emphasized enough; a comprehensive evaluation of a new product’s potential is not complete without consideration of its pack design performance amidst crowded shelves and competing products. 

For more insights and the story of Shilpa’s knowledge gained from not-so-successful new product launches, go to the full session recording that is available here.


Want to know more about pack optimization? Dive deeper and learn how to choose successful claims!

    Strike a balance between native and branded Facebook Ads 

    by Konstantin Tomic, Insights Manager at EyeSee

    This year marks 20 years since Facebook revolutionized the way we use the internet. A lot happened during that time, but as it changed the advertising landscape and influenced its users’ daily lives, Facebook evolved as well.   

    Facebook may not be the place to find the youngest audience (though its audience is diverse and earns money) or the “hottest” platform right now, but some facts are simply unbeatable.  As of the end of 2023, the number of Facebook users worldwide is around 3.05 billion. 

    • 50% of the time spent on Facebook and Instagram is spent watching videos. 
    • 2B+ people watch Facebook in-stream-eligible videos each month. 
    • 74% of Facebook in-stream non-skippable video ad views are completed, globally. 

    So, the question is not whether there should be an investment in Facebook ads, but rather how to do so effectively. As my colleague previously stated, it is critical to test ads because relying solely on platform analytics is insufficient to gain clarity and insights into why some ads are “working” and what their true brand impact is. To gain those insights simulated replicated feeds are proving to be the best tool for capturing user behavior.

    A good replicated feed will make respondents forget they’re part of research  

    Researchers should always be mindful of response bias – a phenomenon where individuals consciously or unconsciously alter their answers to align with perceived social norms, expectations, or desires. Factors such as social desirability bias, where respondents provide socially acceptable responses rather than honest ones, can distort findings. But even smaller things can affect the answers too. Wording of questions, order of presentation, interviewer effects, and respondent characteristics like age, gender, or cultural background can all impact how individuals respond. Awareness of these biases is critical in designing surveys and conducting research to minimize their influence and ensure more reliable data collection and analysis. 

    To minimize biases, it is best to provide respondents with a realistic environment in which tracking devices and differences from their usual habits are difficult to detect. In the case of social media replicated feeds, respondents participate in the study from the comfort of their own homes, and some even admit that there were times when they forgot they were not using “the real thing.” 

    Native VS Branded ad memorability paradox

    Native content outperforms branded ads in retaining attention by captivating audiences with surprising product usage and compelling, attention-grabbing audio. Younger viewers engage with native content for longer durations, making it an ideal choice for subtly targeting this demographic. Additionally, native ads are clearer, largely due to their prominent product features. However, they pose a challenge in terms of memorability since they rely solely on the video to convey branding, which users may overlook. In contrast, branded ad posts benefit from additional cues like account names and video descriptions, enhancing brand memorability. 

    The path to balanced native and branded video ads  

    The first and most obvious recommendation is for marketers to test their ads. Knowing which parts of the video to tweak can help achieve a native-branded balance. Even past campaigns contain knowledge, and testing them can provide brands and marketers with a best-practice guidebook for future creative input.   However, if you already have native content in your hands, here’s a small bonus tip. If focusing on younger audiences – ads with a native feel could be the way but take care to post from the official brand account with an informative description. If the goal is to raise awareness among the general population – a traditional branded ad is a more reliable option.  


    Eager to know more about ad testing on other social media platforms? Research hidden potential with new TikTok creative insights.

      Facial Coding Demystified: The Expert Guide  

      By Vanja Radic, Facial coding team lead at EyeSee

      Ready to resonate with consumers beyond discounts and special offers? Understanding the emotional drivers behind consumer behavior can help embed your product in their hearts and minds for the long haul. 

      Expressing emotions verbally poses challenges for everyone, with surveys often highlighting this difficulty most prominently. This renders surveys alone potentially misleading. Nonetheless, alternative research approaches offer solutions. In addition to asking the right questions, like in real-life interactions, we meticulously analyze facial expressions. This is why relying on Facial Coding as a research method becomes imperative, allowing us to generate both more accurate and more profound insights.

      That is why we have compiled a list of the most frequently asked questions to assist you in successfully understanding and utilizing such a powerful driving force as emotions.

      1. What are the advantages of using facial coding to test advertisements over traditional methods? 

      Facial coding delves into non-verbal reactions, unveiling responses that respondents might not consciously acknowledge, articulate, or be inclined to disclose in traditional survey or focus group settings. Furthermore, it provides insight into the underlying “reason why” behind an ad’s performance, beyond mere measurement, thereby enabling businesses to make better informed decisions. 

      2. What are the advantages of facial coding compared to neuroscientific methods? 

      Marketing research relies on both behavioral and neuroscientific methods to overcome the say-feel gap, as, oftentimes, respondents are not able or willing to verbalize their emotions regarding stimuli. Combining explicit methods like surveys and implicit ones like FC allows us to access both parts of “the dual process thinking,” popularized by Daniel Kahnman as System 1 and System 2 thinking. 

      While EEG, fMRI, and GSR provide deeper insights into neural and physiological processes that facial coding does not directly capture, facial coding complements these methods by focusing on the observable manifestations of emotions and behaviors. Still, certain facial expressions are often associated with specific physiological states, and by observing facial expressions, researchers can infer potential physiological reactions. For example, expressions of fear may coincide with increased heart rate and perspiration; on the other hand, a smile might indicate activation in brain regions associated with reward and positive emotions. 

      In summary, while facial coding doesn’t directly capture physiological or neurological processes, it can indirectly provide valuable information about these processes by analyzing observable facial expressions. It offers insights into how individuals experience and express emotions, providing a behavioral lens through which to understand underlying physiological and neurological responses. Facial coding has three main advantages, comparing to neuroscience methods: 

      1. It is far less intrusive – the need for controlled laboratory settings and the onsite equipment (like EEG Cap, Amplifier and Recording device for both EEG and GSR, GSR sensors, MRI scanner and other associated devices), can make neuroscientific methods considerably intrusive. They require direct physical contact with the participant’s body, or its exposure to strong magnetic fields (as in fMRI). On the other hand, facial coding primarily relies on observing and analyzing facial expressions. It involves capturing video recordings of respondents’ faces while they view stimuli (or engage in tasks). 
      1. It is more scalable and cost-effective – the low intrusiveness leads to higher participant compliance and reduces the need for specialized training to administer the technique. FC can be done online, and it is applicable across the global market since basic expressions are universal to humankind. It can also be easily scaled to accommodate large sample sizes, as it does not require significant additional resources for each additional participant (e.g. limited availability of EEG and GSR scanners). With all that in mind, facial coding is relatively cost-effective and accessible, compared to neuroscientific methods.   
      1. Its output is more readable – although EEG, GSR and fMRI offer baseline complementary information about physiological arousal, neural correlates, and cognitive processes underlying emotional experiences, FC measures more direct and observable indicators of emotional expressions, providing us with output with far better readability that can easily be integrated into research studies. 
      3. What is the process for the coding of facial expressions?

      Respondents are recruited remotely, and by following the testing link, with no need to download any app, they are directed to the testing page. After successfully being screened, they are then invited to provide their consent for facial coding. Subsequently, they are exposed to the stimulus being tested.

      4. How high is the response rate for facial coding studies?

      The response rate may differ depending on the market and other sample specifications, but when dealing with the general population, it is on average 18% ( Brazil 30%, USA 20%, Germany 15%, Japan 8%).

      5. What are the specific emotions our facial coding can record?

      Facial coding can be used to recognize a variety of facial expressions, each associated with specific emotions. The Facial Action Coding System (FACS), developed by Paul Ekman and Wallace V. Friesen, is one of the most widely used systems for coding facial expressions. FACS identifies specific muscle movements, called Action Units (AUs), that correspond to different emotions. EyeSee’s framework relies on FACS and Ekman’s seven basic emotions list, having it adapted to market research needs; by grouping three of the negative emotions (disgust, contempt, anger) into one (dislike), and expanding the list by two cognitive emotions, interest and confusion. In total, EyeSee’s framework is comprised of 7 emotional categories (3 positive and 4 negative): 

      1. Happiness: Indicated by the activation of the zygomatic major muscle, causing the corners of the mouth to lift (AU12), and the orbicularis oculi muscle, leading to “crow’s feet” around the eyes (AU6). 
      1. Surprise: Displayed through raised eyebrows (AU1 and AU2), widened eyes (AU5), and optionally an open mouth.  
      1. Interest: Manifested by lowered eyebrows (AU4 and AU7), 
      1. Confusion: Characterized by a downward pull of the corners of the mouth (AU15) and the upward movement of the chin (The Chin Raise Action Unit AU17), optionally accompanied by an inner brow raising (AU1). 
      2. Dislike: 
        a) Disgust: Shown by a wrinkled nose (AU9), raised upper lip (AU10), and a downturned mouth. 
        b) Contempt: Reflected in a slight one-sided mouth raise, often with the corner of the lip lifted (AU12). 
        c) Anger: Manifested by lowered eyebrows (AU4 and AU7), narrowed eyes (AU4), and a tense jaw (AU24). 
      3. Fear: Evident by raised eyebrows (AU1 and AU2), wide-open eyes (AU5), and horizontally stretched mouth (AU27). 
      4. Sadness: Characterized by a downward pull of the corners of the mouth (AU15) and the inner eyebrows raising (AU1). 
      6. Is tracking a limited number of emotions sufficient? 

      The seven emotional categories allow for a generalized understanding of the emotional landscape without needing to delve into highly specific emotions, which can be more subjective and challenging to interpret consistently. However, while emotional categories offer a useful starting point, they may not capture the full complexity of individual experiences and nuanced emotions. In EyeSee, we open a window into the individual’s experience and specific emotions by analyzing facial expressions within their specific contexts.

      7. What specific metrics can be derived from the facial coding method? 


      Emotional Reach – the percentage of viewers who have had any emotional reaction to the stimulus. 

      Emotional Engagement – the average of total reactions during the whole time of the stimulus. 

      Happiness – the percentage of respondents who have expressed a smile at least once during the stimulus. 

      Surprise – the percentage of respondents who have conveyed an expression of surprise at least once during the stimulus. 

      Interest – the percentage of respondents who have conveyed an expression of interest at least once during the stimulus. 

      Confusion – the percentage of respondents who have conveyed an expression of confusion at least once during the stimulus. 

      Dislike – the percentage of respondents who conveyed an expression of dislike at least once during the stimulus. 

      Fear – the percentage of respondents who have conveyed an expression of fear at least once during the stimulus. 

      Sadness – the percentage of respondents who have conveyed an expression of sadness at least once during the stimulus. 

      Positive emotions – the percentage of viewers who have had any positive emotional reaction to the stimulus.

      Negative emotions – the percentage of viewers who have had any negative emotional reaction to the stimulus. 

      8. How can we tell what triggered an emotion?

      Facial coding second-by-second output for video stimuli is very informative on emotional triggers since it allows us to know what scene from the stimulus triggered an emotion. In cases where the scenes are more complex with multiple potential triggers – the facial coding data can be crossed with eye tracking data as well as with the survey response, allowing us to have a full context and thus be able to pinpoint the emotional triggers and convey an actionable insight. 

      9. What devices and browsers can be used for Facial Coding testing?  

      Facial coding tests can be run on both desktop and mobile environments, with no need to download any app. Our Web Platform supports multiple browsers for mobile: Google Chrome, Mi, Samsung Internet, and majority of integrated browsers, covering 70% market share, and when it comes to desktop – Google Chrome, Opera, Edge, Firefox, Safari, and AVG Secure Browser, covering over 99% of the browsers available.

      10. How are emotions connected to brand impact? 

      In EyeSee, we conducted research with 18 short ads (from 7-15 seconds) with the objective of finding out how facial coding correlates with some of the most relevant survey and retention KPIs (see the list visual below). The significance level taken into account was 0.05 (equivalent to 95% significance) and Spearman value correlation being above 0.3 and below -0.3*.  

      All three facial coding KPIs were significantly correlative with Likability (on average 0.32) and Uniqueness (avg. 0.46). Besides the two mentioned correlations, the Happiness KPI is also positively correlative with Stopping power, ad sharing potential, and the statement “It makes me think that this brand is really different from its competitors.” As for the negative correlations (statistically speaking), respondents who expressed higher happiness tend to rate the stimulus as less ordinary (-0.42).   

      *Two main types of correlations are positive correlation and negative correlation (0.3 for positive correlation and -0.3 for negative), and they describe the direction of the relationship between the variables, as two variables may move in the same or opposite direction.

      11. How are emotions connected to purchase decisions? 

      Although rational appeal in advertising is very important, it is not appropriate for certain products, especially those that are not that different from the products of their competitors in functionality, olfactory, or technical characteristics. That is when emotional appeal, which consists of creating certain emotional associations in the consumer’s mind towards the advertised product, fosters great results in purchasing decisions (in those cases, a unique selling proposition is replaced by a unique emotional proposition).

      The word emotion comes from Latin and is derived from the word emotio/emovere, which essentially means “to move out” or “to stir up.” Therefore, emotions are connected to purchase decisions by creating a desire for the associated products (or a lack thereof). Unfortunately, this link is hard to measure since, unlike short-term promotions and discounts, its influence is more of a long-term nature as it is developed over time in the privacy of the audience’s subconscious mind. However, what we can measure is brand impact.

      In sum, it’s convenient to view the act of purchasing as a “behavior” and desire as the “mental state” that drives it. In this context, facial coding provides insight into the underlying state of mind, which is crucial for guiding desired behavior, such as making a purchase.

      12. How do we benchmark our facial coding KPIs? 

      When assessing an ad’s performance on an emotional level, providing relevant facial coding benchmarks is a must since there are no universal truths when it comes to gauging a creative’s performance. Stimuli of different lengths attain different levels of attention and allow for different emotional engagements to be developed, which is why the stimuli length is the first criterion to be applied. Additionally, it’s important to consider the creative approach employed in creating the stimulus, such as whether it adopts a collage or a movielike style (collage or movielike). And although a global benchmark is a good fit in some cases, for some markets it is best to apply a culture-specific benchmark (i. e. for a study conducted in Japan, an “Asian benchmark” would be the best fit, since this market is characterized by more subtle expressions).

      Apart from culture-specific benchmarks, many of our clients are interested in testing the animatics version of ads, in order to fine-tune them in the earlier production stage or select the winning ad, and this is where our animatics benchmark is applied. Furthermore, taking into account the industry adds another layer of benchmark specification, as emotional profiles and levels of engagement can vary significantly within different sectors.

      In conclusion, it is essential to consider both sample and stimuli specifications when conducting significance testing, and an extensive benchmark base allows EyeSee’s research team to do that, thus reaching reliable conclusions.

      13. Is the presence of negative emotions by default a bad thing, and should they be avoided? 

      Depending on the ad’s narrative, negative emotions like disgust, contempt, sadness, and fear can be a part of creative objectives. While it may seem counterintuitive to intentionally trigger these emotions, they can be powerful drivers of action, especially if your product or service offers a solution to them. This is why valence-based approaches, which limit themselves to positive and negative emotion-oriented KPIs, are to be taken with reserve; they are less explanatory when used alone without emotional profiles since they do not take into account that emotions of the same valence differ in essential ways.

      14. What if some parts of an ad elicit no emotions?

      When using facial coding to measure emotional engagement in any dynamic content, it’s not necessary or realistic to expect that every single moment will elicit an emotional response. The goal is rather to identify key moments or elements that successfully engage the audience and evoke the desired emotions. Neutral respondents can also be engaged (with neutral facial expression), but they can still be fully locked in; this is where facial coding is complemented by retention

      15. Dislike often appears at the end of an ad, simultaneously with the brand logo – how should this be interpreted? 

      Dislike at the end of an ad is probably a reaction to the attitude of ‘just another ad’, not necessarily to the brand itself. Still, it might indicate that the creative failed to come across as entertaining/educational content by being too obvious or tactless in revealing the brand. Surveys can be a good add-on by providing another layer of confirmation. 

      16. Can facial coding be regarded as confirmation of attention? 

      Facial expressions do confirm attention, but the absence of facial expressions does not necessarily indicate a lack of attention. 

      The relationship between attention and emotion is unidirectional (one-way): if respondents are emotionally engaged with the stimulus, it indeed means that the stimulus has their attention – however, if respondents are not emotionally engaged with the stimulus, it does not preclude them from paying attention. Attention and emotional engagement represent distinct yet complementary responses to stimuli, both of which we assess separately using the Retention and Facial Coding methods. 

      However, facial coding as a method brings much more into the picture than merely confirming attention: it delves into second-by-second emotional engagement, capturing the highs and lows of emotional responses and identifying specific emotions over time. This detailed analysis offers valuable insights into how tested stimuli can be adjusted to evoke intended emotional states. In essence, facial coding and retention measurement assess two distinct qualities of stimuli and should be regarded as distinct yet complementary tools for understanding audience response.

      17. What is the ultimate benefit of utilizing facial coding? 

      Besides being both the least intrusive and the most scalable method, facial coding serves as a window to honest feedback on emotional engagement, thus allowing creative teams to answer the following questions: 

      1. Does the creative resonate with the target audience on an emotional level? 
      1. Is the content creating the intended emotional state? 
      1. Which are the most engaging parts of the stimulus? 
      1. Where are the emotional peaks? 
      1. Based on 1-4, what are the learnings, and how can they be leveraged to design narratives that bring brands closer to their audience? 


      Curious to know more about Facial Coding and Social Media testing, read more here.

        Behavioral insights about women by women 

        EyeSee is comprised of 61% women who drive forward 100% of pioneering research! Throughout much of the 20th century, research predominantly revolved around men; with men often occupying the roles of both researchers and default study participants. In doing so, we inadvertently overlooked the intricate and captivating traits of female consumers, as well as the unique perspectives of female experts.  

        Today, let’s acknowledge past shortcomings and enthusiastically embrace the richness of diverse female perspectives, insights, and needs. Here’s an insight into the specialized knowledge that women, particularly those in research roles, offer about women. 

        Grooming preferences: Are gender neutral options killing the pink tax?  

        Coined in the 1970s, the term “pink tax” signifies the pricing disparity between products marketed to men and women. For years, disposable razors have exemplified this disparity — the identical product often commands a higher price when packaged in pink. Research shows that women’s four-blade razors were priced 66% higher than men’s on average! 

        Many women, wanting to avoid paying an extra buck for what is essentially the same product, revert to buying disposable razors for men.

        In certain EyeSee research studies, brand perceptions have shown improvements through the introduction of gender-neutral options. This trend has been notably observed in categories such as children’s toys and perfumes

        Perimenopausal skincare: The uncomfortable truth 

        This Women’s Day let’s celebrate the strength and resilience of women by focusing on a critical yet often overlooked stage in their lives: (peri)menopause.  It’s a transformative journey marked by physical changes and deep reflections, in which many women start prioritizing personal needs and desires above societal expectations.  

        72% reported that they noticed changes in their skin at perimenopause/menopause, while 50% felt they had been insufficiently informed about these symptoms, highlighting the need for educating women and healthcare professionals on the impact of menopause on the skin. 

        As women navigate the perimenopausal stage, skincare emerges as more than a routine — it’s a feminist statement. By embracing self-care, women affirm their autonomy and redefine beauty on their terms.

        Exploring the pandemic’s influence on wellbeing: The beauty comes from within 

        Social pressures remain important factors for women’s consumer choices overall, but after the pandemic we saw a significant surge in more sustainable options

        To make healthier and more sustainable choices, many women seek additional information and education about products and whole categories. If you are a brand, make sure ingredients, new technology and other benefits are readily available as part of e.g. landing pages, packages, and influences videos. The information gathered is used to make unique habits and personalized rituals. 


        If you are interested in more pioneering trends and research, check out our blog on TikTok Creative Guidelines for Powerful Ads based on a comprehensive study that involved 20 brands! 

          [White Paper] TikTok First Content Guidelines for Powerful Ads

          Your ads and messages are alright, but you’re itching for something new and exciting. Want a way to jazz up your brand, make it pop, and get people buzzing again?

          The next frontier for marketers globally is to harness the power of your brand on TikTok! An incredible 81% of users say TikTok videos influenced their recent purchases, and a recent EyeSee study discovered that 56% of sponsored content is seen on average, and 73% of users like the ads they see. Gen Z is also redefining search: They’re more likely to use social networks than search engines when looking up brands, products, or services, according to GWI, and 50% of them will choose TikTok. 

          TikTok First Content Guidelines are now available!

          So, if you are wondering how to effectively break through the clutter while still conveying the right message with a fresh approach, “TikTok First Content Guidelines for Powerful Ads” is the white paper for you! Discover:

          1. Why is the TikTok First approach more effective than TVC-style ads? When created in TikTok First style, the ad’s stopping power increases by 17%.

          2. What can earned attention and emotional connection do for your brand? Skippable ad formats like TikTok represent true eyes on the screen. Viewers truly see what they look at, as opposed to just gazing over it. 

          For content that achieves high emotional reach (>30%), it is noted that there is a 25% uplift in brand uniqueness, a 15% uplift in likeability, and a 14% uplift in improved brand opinion.

          3. The story behind the Scotch-Brite success story and how they did it. EyeSee study “TikTok ad magic: A performance study” shows that Scotch-Brite ads, created in a TikTok First manner, achieve an impressive stopping power of 76%, significantly surpassing the North American benchmark for the CPG industry.

          4. What are insight-based guidelines for using the most powerful TikTok effects? There is a 19% increase in brand interest and a 23% increase in brand opinion when the TikTok First ad contains effects such as emojis and stickers.

          But if you want to know the power of music, voice-over, ASMR, product display, and what the recommended narrative approach is, check out the full “TikTok First Content Guidelines for Powerful Ads” white paper now. 


          Eager for more? Read the blog about replicated feeds for authentic behavior here.

            Key learnings from Lunar New Year pack designs that drive purchase  

            by Xinyu Tok, Senior Insights Manager at EyeSee

            Growing up celebrating the Lunar New Year, I treasure memories of getting new clothes, cousin playdates, red packets, and indulging in festive snacks, sweets, and drinks. Our home was adorned and filled with an array of treats in red containers (both sweet and salty), along with a colorful lineup of soft drinks for guests. Just reminiscing about these moments fills me with joy.  

            However, having been in the market research industry for more than five years, seeing the display of festive treats in stores and homes this Lunar New Year got me thinking about their pack designs and how they influence me as a consumer. In EyeSee, we always ask three main questions about the product we are testing.

            Will the consumer: a) see it, b) like it, and c) buy it?

            So, I wondered how special occasions such as the celebration of the Lunar New Year impact consumer behavior. When a brand invests in a special edition package, will it indeed be: seen, liked, and bought? 

            Being visually salient and distinctive is a real challenge 

              Not only that, consumers see it as a sea of festive red Lunar New Year treats, be they on the shelves, product listing pages, or shopping catalogs. While being in line with the festive color, products have the difficult challenge of capturing attention and attracting consideration. Personally, the shelves for Lunar New Year festive treats tend to be a blur in my visual background as I go about my shopping tasks.

            A recent exception is when I came across a Hello Kitty branded festive snack that is certainly distinct from others. Despite taking a double look, I placed it back on the shelf, as the Hello Kitty brand was not enough to convince me to purchase it.  

            Attracting attention is only the first step in making a purchase; the product pack or display must also be convincing enough in its offer, pricing, and claims to convert into a sale.

            Successful special edition products that ended in homes 

            Of course, there is no simple answer to the question above. How to stand out on the shelf when occasion dictates similar design package rules. However, in context, virtual shopping testing for highly predictive insights is always the first thing I recommend. But what we can do right now is analyze several products that actually stood out and were bought by me or my family members.  

            Minimalism that highlights traditional quality  

            While visiting my relatives, I noticed that many of their Lunar New Year festive treats are from the Ding Bakery brand. Yet, as you see below, the brand adopts simple packaging without outstanding elements.  

            What could be driving their purchase? 

            Going onto their product pages provided some clues. Take its pineapple tarts, for instance. Cues signaling their great taste had the effect of activating my craving for them! A close-up of the artfully displayed pineapple tarts, one half-bitten and the other held, provides powerful visual cues as well. The display of eggs signals the use of natural ingredients and is an indicator of quality. Flour, which is also lightly spilled, supports its freshly baked, delicious promise. Multiple credentials further back its claim of an award-winning taste.

            Connect emotionally with cultural elements but stay unique  

            When I gifted love letter snacks recently, I chose one from the Ming Ang brand with a beautiful tin design that emphasized its traditional handmade Nyonya recipe. Its latest Lunar New Year design features delicate colors and floral patterns that convey its Nyonya heritage. While the light peach, purple, or blue color palette may seem atypical of the Lunar New Year, the rich maroon packaging sleeve with gold embossing visually anchors the products with the festival – supporting alignment with cultural expectations.

            Even non-traditional sweets can be dressed for the occasion

            At EyeSee, we have tested Lunar New Year packs, and it showed that festive and culturally relevant designs stand out more in attracting purchases. Lunar New Year-associated elements in the form of colors, motifs, icons, and zodiac signs anchor products with positive festive emotions.

            It can seem like a tricky thing to achieve when snacks fall outside of the typically traditional type of treat. However, those brands can also integrate such cultural elements for greater relevance during the Lunar New Year celebration. One of my favorite examples is KitKat’s Lunar New Year tin. Its fiery dragon, alongside a well-appointed seal, conveys blessings of success in the new Year of the Dragon. On top of that, the wafers’ golden bar appearance is a relevant signifier of prosperity. And, what is a better occasion for customers to try KitKat with the flavor of orange than this? 

            In conclusion  

            As a festival rich in culture and tradition, Lunar New Year offers brands a wide arena to incorporate psychology and cultural understanding into interesting, meaningful pack designs. Visual salience and distinctiveness, activating the senses, and incorporating cultural elements are some examples of strategic approaches in line with the intricate nuances of our behavior during this festive season.  

            For more ideas on how your everyday or festive pack designs can stand out to drive sales, explore our blog, or podcast, or simply reach out to any of us.

            Wishing all a very blessed and prosperous Year of the Dragon! 


            Interested in reading more? Read about in-store display designs in the article Road to growth: Understanding travel retail consumer behavior.

              Build on social media ad impact with behavior-savvy strategies 

              By Minja Stojanov, Internal Business Development Director at EyeSee

              As of 2022, the average daily social media usage of internet users worldwide amounted to 151 minutes per day, and Western Europe had a 79 percent social media penetration rate, topping the ranking of global social media usage by region since January 2023, Statista reports say. Not to mention that 81% of people between the ages of 30 and 49 actively use at least one social media site. 

              Numbers cannot be more clear; social media are officially an integral part of all our lives. They are places where we connect, inform, share advice and experiences, and sometimes even make direct purchases that are available via the emerging possibilities of social shopping. What is particularly interesting is that, recently, Instagram has been offering analytics, even to private profiles.   

              All of this indicates that there is a strong need for true social media influence to be understood.

              Social Media Analytics VS mix of behavioral and traditional testing methods 

              However, are social media analytics sufficient to understand how content affects us and how it works? If we imagine brand managers who are budgeting for content production and strategy for the coming year and want to use analytics to determine the success of previous years’ social media ads, what insights would they have? Are the numbers showing the reach of some ads sufficient to determine whether the audience engaged with the ad or the brand in any way?   

              For reliable and valid insights, it is crucial to use a mix of behavioral and traditional methods focusing on consumer behavior in the timeline and its impact on sales uplift.   

              • Eye tracking allows granularity into which ad elements are seen and which are often missed. Analyzing the social media heat map is highly beneficial for the placement of key ad information.  
              • Facial coding identifies whether consumers are engaging with your brand by analyzing their emotions through facial expressions. 
              • Surveys help uncover what the ad impact on brand metrics is. When we combine Facial Coding, Eye Tracking and Survey results we get what the true ad impact on consumers was and more importantly WHY.  
              • Virtual shopping provides a direct link between the performance of an ad and in-store purchase behavior with the help of realistic simulated store environments that tap into authentic consumer behavior. 
                 

              Main KPIs and benefits of replicated media Feeds 

              Did you know that people’s average focus per post on Facebook’s timeline is 4.1 seconds, 2.7 on Instagram feed, 3s on TikTok, and that for Facebook and Instagram, there is a 19% decrease in visibility when an ad is lower in the feed?  

              For uncovering the sophisticated differences in behavior that would go undetected with traditional social media analytics, research tools such as replicated social media feeds and the right thought framework are crucial.  

              That is why here are the metrics and KPIs you need to know about your ad performance: 

              a) Ad breakthrough: 

              1. Visibility –  how many users have actually seen your content? 
              1. Attention – how long do they watch it for? 
              1. Video retention – what are the usual points where you start to lose them? 

               b) Ad emotional engagement and brand impact:  

              1. Emotional reach – is the ad resonating with them? 
              1. Survey KPIs – does it fit with the brand, and do users like it? 

               c) Ad sales impact: 

              1. Sales uplift – does the ad impact sales? 

              Building brand success on best practices and creative guidelines 

              If we go back to our imaginary brand manager from the beginning of this article, one might rightfully ask: How can I benefit from the knowledge of the campaign that is already done? 

              Imagine how much time you would save by not having to go back and forth with briefing the creative agencies and influencers but having all the insights along with content recommendations and a set of rules in one best practice playbook.

              In conclusion

              If you are interested in learning more, I advise you to reach out and ask us for our global study, a meta-analysis of almost 60 ads from 20 brands called “TikTok Global Study: Creative that Works.”. Or you can find a brief overview here and take it from there.   

              This study gave us, our clients, and TikTok, not only valuable insights and creative guidelines but it proved that social media campaigns are efficient across industries from FMCG, OTC, Personal and home care, and all the way through Durables and in some cases even Financial and other services.  

              But, no matter the industry, one thing is certain: you want your brand to be where your consumers are, and you want it to be part of their lives. In that process, social media is a crucial component of your brand’s social life among its consumers, and it needs to be done right. A best practice and creative guideline playbook is a tool one needs for that.


               Eager for more? Read how to: Capture their attention first, and the ‘heart’ next: attention & emotions in social media advertising

                Road to growth: Understanding travel retail consumer behavior

                by Koen Philippaerts, New Business Development Manager at EyeSee

                I just returned from visiting my family in Europe, and aside from having a nice holiday, I realized that the time I spent waiting on my flight changed my purchasing habits. In the duty-free zone: I found myself wandering around a product category I am not usually interested in, eating lunch when I usually eat breakfast, and purchasing some tech gadgets I did not intend to buy. 

                Conde Nast Traveler’s article says that people travel the skies, rails, roads, and seas to tick off major bucket-list moments. So, shifting behavioral patterns and traveling go hand in hand, and a big part of that is the travel retail centers we visit along the way. It is where every journey begins and ends; it is a necessity, but it is also important for travel retail to be convenient, pleasant, and enjoyable.  

                So, does it come as a surprise that Statisa predicts that the global travel retail market will reach 174.9 billion US dollars by 2030?

                How is travel retail different?  

                Travel retail centers are places where consumers are ready to try something new, and brands must be able to give their best and use the opportunity to introduce themselves to new customers, showing their loyal ones that their favorite brand goes where they go. 

                A Statista survey shows that:

                • 48% of travelers think that a variety of products makes Duty Free a great place for shopping  
                • 47% of travelers say it is a great place to try new brands  
                • 45 % are more motivated to buy Duty-Free exclusives  
                • 43 % consider travel retailers a great place to buy gifts  

                Unlike standard ones, travel retailers are one of the main distribution channels in the beauty industry (if beauty retailers are put aside). The main categories travel retailers feature are perfume and cosmetics, liquor, confectionery, tobacco, food & beverage, electronics, accessories (bags, watches, eyewear, etc.) 

                 When consumers enter the duty-free zone, in most cases, they have some free time on their hands before onboarding starts. Nicely displayed brands will get anyone’s attention, and to be honest, probably some last-minute gift shopping will be part of spending that free time.  Unique display designs can help brands stand out in product displays, as Galvinet Whiskey did when they displayed their bottle as a museum artifact. It was beautifully lit and covered with a protective glass box. All of this was in line with “tradition” as one of their core values: they are Scotland’s oldest legal whiskey distillery. Not only that, from the front of the liquor bottle display stand to the back of the product packaging, the Roman numerals 35 are emphasized. Any Glenlivet enthusiast and collector would instantly know this means a rare bottle of liquor because it’s not in the brand’s collection.   

                Graphic solutions are not the only way to shed light on more information in places where people have some extra time to kill. Sometimes that can be shop assistants who engage in further conversation with consumers. If out-of-the-box design solutions and shop assistants handling your brand’s key values sound risky, note that EyeSee has solutions for testing both.  

                However, all of this is just the tip of the iceberg when it comes to possible brand touchpoints in travel-type environments. Purchases can be made on planes. There are also all sorts of marketing materials that consumers can pass by: from airplane magazines, brochures, and leaflets to much bigger ATL prints or on-screen ads. The possibilities are endless!

                What can we learn from travel retail? 

                There are many types of point of sales displays: 

                • Counter displays  
                • Free-standing display units  
                • Product displayed quickly units  
                • Light boxes  
                • Gravity feed display units  

                The creative potential of these displays is limitless. Recall the enormous cardboard fence constructed from KitKat bars and the point-of-sale box brimming with an abundance of KitKats, a temptation to dive into. And the best thing about it is that it would work not only for travel retailers but in supermarkets too. 

                Over the last couple of years, the market research industry has seen a steady rise in online context testing solutions such as virtual stores, which offer cost-efficient and fast findings but also boast very high validity. Apart from providing stable results even in changed circumstances, Virtual shopping has a very high correlation with real shopping behavior – as much as 0.8-0.9.   

                EyeSee’s in-house design capabilities enable the customization of any type of virtual shopping environment. Furthermore, a multitude of pre-built, standardized shelves are already accessible across over 80 categories. State-of-the-art graphic solutions can be designed in 2D, 2.5D, and 3D models and provide high levels of consumer immersion that help produce authentic insights.

                In conclusion  

                Understanding consumer behavior in travel retail serves as a valuable compass for brands seeking inspired growth. The unique environment of duty-free zones, characterized by ample free time and consumer openness, offers an exceptional opportunity for brands to engage and leave a lasting impression.

                Brands that understand and leverage these unconventional retail rules stand to unlock untapped potential and navigate non-standard points of sale successfully.  As the market research industry embraces virtual shopping solutions like EyeSee’s, the prospect of testing concepts and display designs becomes more efficient, cost-effective, and aligned with real shopping behavior, emphasizing the importance of staying ahead in an evolving consumer landscape. 


                Are you eager to know more? Read Everything you didn’t know about the design of in-store displays.

                  Five behavioral research postulates to keep in mind for a successful e-commerce strategy

                  E-commerce is now an essential part of every consumer’s shopping habits. Online and offline shopping experiences are more intertwined than ever before, and as we discussed in the most recent Deep Dive episode with Morana Kristek (New Business Development Director at EyeSee) and Rebecca Lacerda (client-end e-commerce thought leader), a holistic approach to shopper behavior is critical to planning both online and offline shopping experiences.   

                  To make some kind of system in such a branched shopper movement and try to be as predictive as possible, keep these five things in mind.  

                  Map the market  

                  In an average supermarket that contains around 50k SKUs, consumers spend only 5 seconds per aisle, while EyeSee’s data shows that online shoppers browse the product list page between 15 and 20 seconds searching for the right item. These numbers tell us that competition is fierce and attention spans are challengingly short; every product touch point counts, whether it is in the online or offline world.  So the first thing you want to do is map the market by asking these questions.

                  Who is this consumer? What are the consumers looking for? What are the relevant players in the segment or industry I’m playing in? Who are my competitors? Which are the platforms that will complement the assortment that I’m offering or the service or experience that I’m offering through my platform? And then, how are those players positioned in terms of pricing, brand positioning, brand potential, et cetera?  You may not have all of the answers right away, but as you begin to research the market, answers will emerge one question at a time.   

                  Never lose sight of the bigger picture  

                  One thing that we should bear in mind is that when we are thinking about online and in-store consumers, we are talking about the same people. This whole separation that we do between online and offline as if they were completely separate worlds is not very accurate because nowadays what we have is a hybrid experience with a hybrid consumer who many times researches or searches for the product online already knowing that they will buy offline, or the other way around.

                     
                  When we accept an in-context holistic approach can we position our product in the e-commerce market correctly.  Only a few people end up clicking on the ad itself (2%), so do not expect your revenue to increase from ad conversion. The way the ads influence the shoppers is that they subconsciously drive interest in the advertised product, which then gets purchased on its primary position i.e. the list.  However, this does not work for all products and all categories equally. An uplift in brand purchase can be as high as 40% for different categories, but as low as non-existent for others. To find out more about it read our Leverage ads in online shopping: Amazon Fresh behavioral study.

                  Be present at the key touchpoints  

                  If we look only at the online consumer movement, we can see that it is far from linear. Passive tracking is the predictability tool you need. It helps to understand not only the consumer’s motion but the keywords of consumer language too.  It answers key questions

                  • Which touchpoints are most frequently visited?   
                  • What is the typical number of visits?  
                  • Where do visitors come from?  
                  • Where do they land on the retailer’s website?   

                  Having these answers means you will be able to wisely direct communication, pick the right product placements, and make the ROI certain. There are four stages of passive tracking set up:  

                  • Defining all the keywords relevant to the category of interest  
                  • Programming the study and implementing all the relevant keywords   
                  • Gaining respondents’ consent to pull their browsing history   
                  • Pulling browsing history for the analysis, including any predefined keywords  

                  It can be applied throughout 30, 60, or 90 days. Along with Eye Tracking, Surveys, and Path to Purchase, buying your product will be the final customer destination, no matter the road they take.  

                  When a consumers are on your landing page, make sure not to lose them 

                  Around 70% of e-comm shoppers abandon the cart without completing the purchase, and there are many reasons for that – maybe they just investigated online and will shop offline; maybe they need more time to decide; but it can also happen that the process of checking out is too complicated and not easy to understand, so by fixing it, you directly increase conversion rates. 

                  Did you know that when shoppers search for a product 49% of them search category name, 17% of them search for category name plus pack type and only 12% of them search for category name plus brand name.  Test the path to purchase shoppers’ behavior.

                  In EyeSee we track how a person navigates through the live page (so it’s a real behavior, or as close as it can be), and we also expose consumers to some relevant static pages, usually a Product Listing Page (PLP is similar to a shelf in a regular BM store, it’s just much more cluttered and pictures of products are smaller; imagine a PC or mobile screen with a list of hundreds of products that you scroll through) and Product Details Page, but it can be anything else, such as Search Result Page, Add to cart/Checkout process, A+ Premium content (or any Promo content), whatever we think might be relevant to investigate or have indications it might be a bottleneck. On static pages, we want to know where consumers’ attention goes, for how long, and how visible or engaging the products and website elements are. 

                  When top to bottom isn’t an option, reverse it  

                  Most commonly, managers choose a top-down approach: to start first with a strategy to identify who our online shoppers are, where they search for our product, and what the drivers are for choosing specific channels, then move to testing shopper behavior and the path to purchase on specific details, and then, in the third level, test tactical marketing assets like ads, packs, banners, standard pack versus hero image, reviews, and checkout. However, sometimes it might be a good idea to take a bottom-up approach. This is the case when you don’t have a firm digital strategy yet but, for example, want to get some quick wins. You want to showcase that digital testing makes sense and that you can have wins in terms of conversions, a smoother consumer journey, and a better consumer experience. So, for example, you can test the Regular Pack versus the hero image pack, and here, you can show your departments and your wider team that the hero image performs significantly better in terms of conversions, sales uplift, and brand uplift. This is an advantage to use to get more backup to do wider-range service and maybe even create a complete digital strategy.  


                  Find out more about online advertising in the related blog about what makes a good social media test or case study about effective online pack shots.

                    Universal Robina x EyeSee: the secret to a successful TikTok campaign  

                    By  Xinyu Tok, Senior Insights Manager.

                    In the previous article, we already stressed the strong impact that TikTok has on consumer purchase decisions as well as the reach that sponsored content can have if done properly.    

                    The figures speak for themselves:   

                    • 71% of TikTok users stop and watch the first three seconds of the video 
                    • 56% of each sponsored piece of content is seen on average 
                    • 73% of TikTok users like the ads that they see  

                     As we explained, we tested 60 ads from 20 brands across markets and industries such as FMCG (Fast Moving Consumer Goods), Beauty, Insurance, Fashion, Technology, Automotive, Retail, etc. TikTok simulations, standalone ads, and surveys were tested among 7280 respondents. All of the respondents were TikTok regulars who had purchased items from some of the categories in the previous six months. You can request the study walk-through at [email protected]

                    Universal Robina is a great study example since their FMCG portfolio is impressive, and they turned out to be one of the winners in the game of TikTok. Let us take a closer look at the testing process and the outcomes.

                    What works better: native versus heavily branded approach

                    When it comes to ad style, brands typically choose between two options. They either create a single video and distribute it across all platforms, even though each platform has its own set of rules, or they assume that the native approach will win. Of course, creating a single video for multiple platforms is more cost-effective, but the native approach yields better results on a specific platform. However, both of those theories have their ups and downs, and the key is to test them, preferably in a simulated digital environment. By using natural and unforced exposure of the stimuli in an environment as close to reality as possible, we get an objective and accurate insight into the actual ad visibility.  

                    In the TikTok simulation, respondents saw three videos: an advertisement for Great Taste, Cloud Nine, and Jack’n’Jill. We also consider the focus (time spent on the screen), retention (percentage of people who watched the video), and stopping power (percentage of people who stopped to watch the video) of tested ads.  

                    Great Taste and Cloud Nine ads performed better than Jack’n’Jill in terms of focus, with 8.6s vs 7s; however, because Jack’N’Jill used a more native organic approach, it performed better in terms of retention and stopping power. (77% vs 57% and 86% vs 74%).

                    But does this necessarily imply that Jack’N’Jill performed better in terms of brand visibility? Not necessarily. With the organic approach, there is always the risk that the video will be insufficiently informative and that the key message will be missed.

                    What prompts TikTokers to recall brands more?  

                    It is important to note that not only are all three tested stimuli different in style, but they also place the product in a different place in the timeline. Great Taste and Cloud Nine commercials have great dynamics and upbeat music, and the Jack’N’Jill approach is more raw and native; however, both approaches scored good brand recall, with only 2% of the difference in favor of Jack’N’Jill (74% vs. 72%).   The key finding, however, is that watching the entire video increases brand recall by 35% compared to viewing only half of it. 

                    Key findings  

                    Universal Robina ads performed extremely well, so one of the key takeaways is that they should maintain TikTok content style while also maintaining their core brand attributes. They succeed in keeping users’ attention by using upbeat music and video dynamics, and they get their message across.

                    Oversimplification of the video should therefore be avoided. Because user attention is difficult to maintain, quick changes of scenery rather than just one setting are preferable. And, as previously stated, a native approach is not without risks, so whether it is appropriate for your brand depends on the strategy and campaign goals.

                    However, to see the full results of the Universal Robina study and to learn more about post-pandemic shoppers, watch the video below. There you will find the full presentation that debuted at the Asia Research Breakfast, which we were fortunate to attend as guest speakers. Also, don’t forget to acquire the whole study walk-through at [email protected]


                    Interested in reading more about global TikTok study? Click here.

                      Thanks for your interest!

                      We”ll get back to you promptly