EyeSee is comprised of 61% women who drive forward 100% of pioneering research! Throughout much of the 20th century, research predominantly revolved around men; with men often occupying the roles of both researchers and default study participants. In doing so, we inadvertently overlooked the intricate and captivating traits of female consumers, as well as the unique perspectives of female experts.
Today, let’s acknowledge past shortcomings and enthusiastically embrace the richness of diverse female perspectives, insights, and needs. Here’s an insight into the specialized knowledge that women, particularly those in research roles, offer about women.
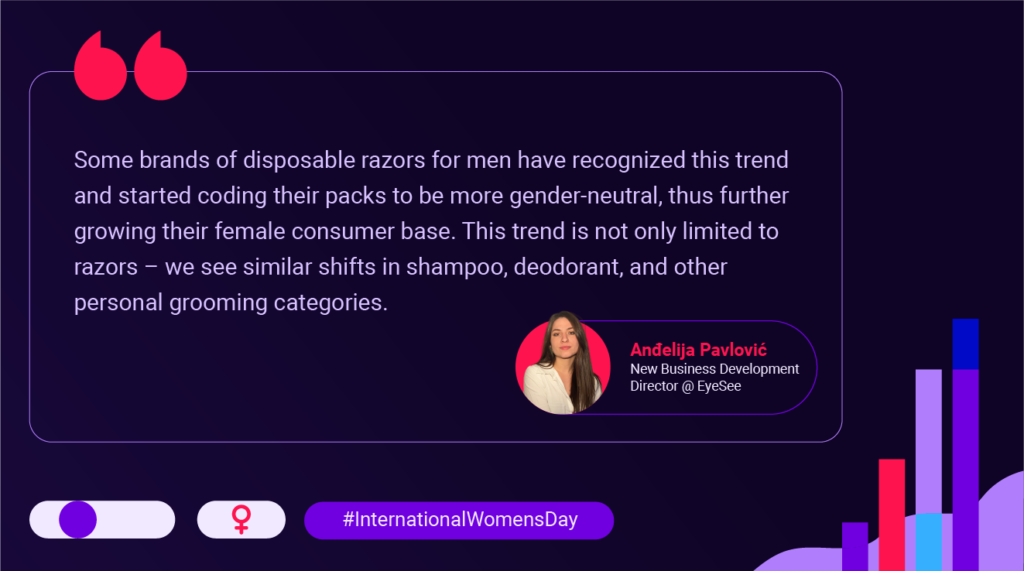
Grooming preferences: Are gender neutral options killing the pink tax?
Coined in the 1970s, the term “pink tax” signifies the pricing disparity between products marketed to men and women. For years, disposable razors have exemplified this disparity — the identical product often commands a higher price when packaged in pink. Research shows that women’s four-blade razors were priced 66% higher than men’s on average!
Many women, wanting to avoid paying an extra buck for what is essentially the same product, revert to buying disposable razors for men.
In certain EyeSee research studies, brand perceptions have shown improvements through the introduction of gender-neutral options. This trend has been notably observed in categories such as children’s toys and perfumes.
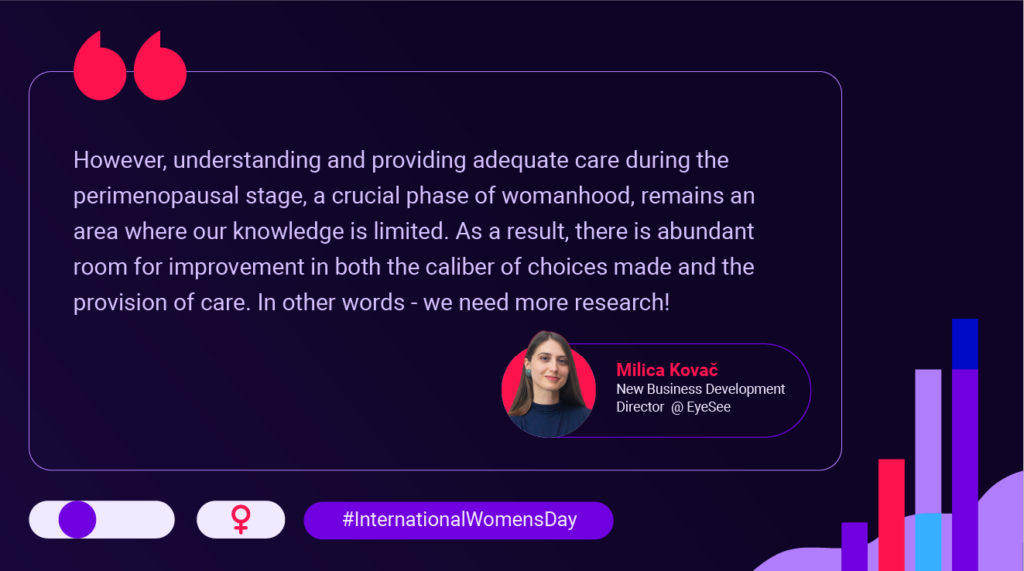
Perimenopausal skincare: The uncomfortable truth
This Women’s Day let’s celebrate the strength and resilience of women by focusing on a critical yet often overlooked stage in their lives: (peri)menopause. It’s a transformative journey marked by physical changes and deep reflections, in which many women start prioritizing personal needs and desires above societal expectations.
72% reported that they noticed changes in their skin at perimenopause/menopause, while 50% felt they had been insufficiently informed about these symptoms, highlighting the need for educating women and healthcare professionals on the impact of menopause on the skin.
As women navigate the perimenopausal stage, skincare emerges as more than a routine — it’s a feminist statement. By embracing self-care, women affirm their autonomy and redefine beauty on their terms.
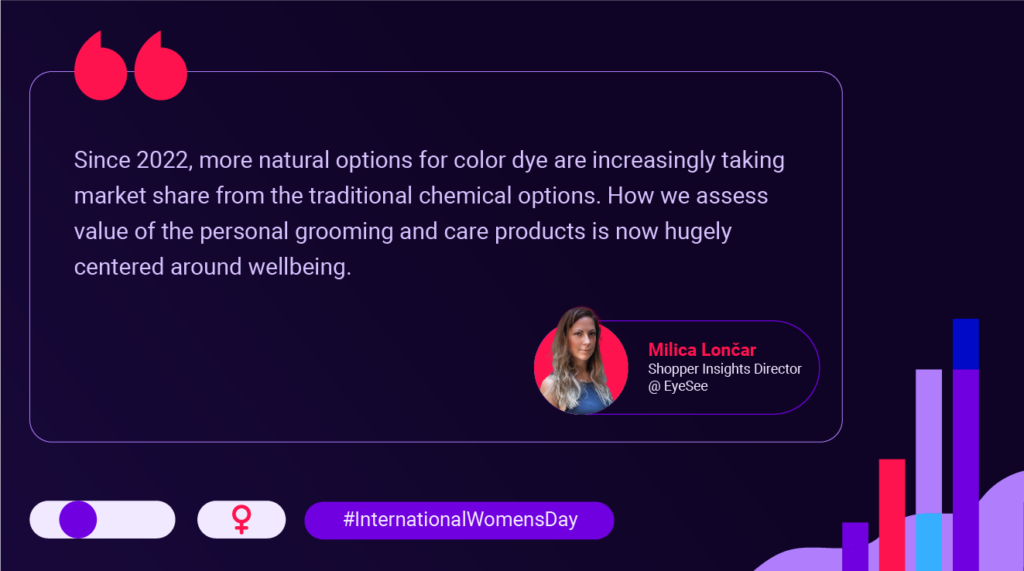
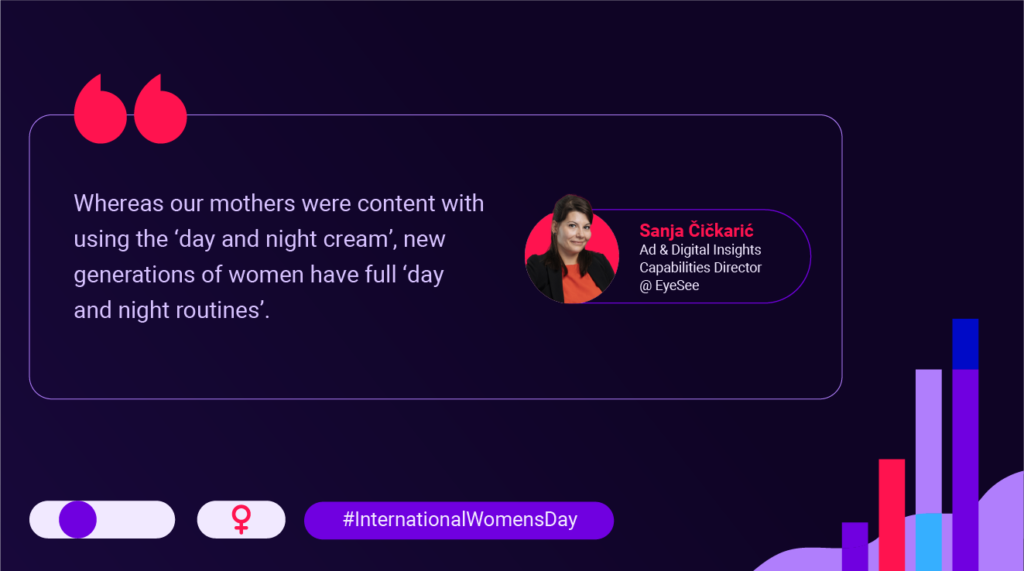
Exploring the pandemic’s influence on wellbeing: The beauty comes from within
Social pressures remain important factors for women’s consumer choices overall, but after the pandemic we saw a significant surge in more sustainable options.
To make healthier and more sustainable choices, many women seek additional information and education about products and whole categories. If you are a brand, make sure ingredients, new technology and other benefits are readily available as part of e.g. landing pages, packages, and influences videos. The information gathered is used to make unique habits and personalized rituals.
If you are interested in more pioneering trends and research, check out our blog on TikTok Creative Guidelines for Powerful Ads based on a comprehensive study that involved 20 brands!
If you require insights and knowledge to help you achieve clarity on your brand’s growth and development, then the “2024 Insights in focus” e-book is what you need. Get in touch via [email protected] and it will soon be in your inbox!
Inside, you will find:
8 case studies (about #social_media, #pricing and inflation, #NPD, #shopper and #HFSS, and more)
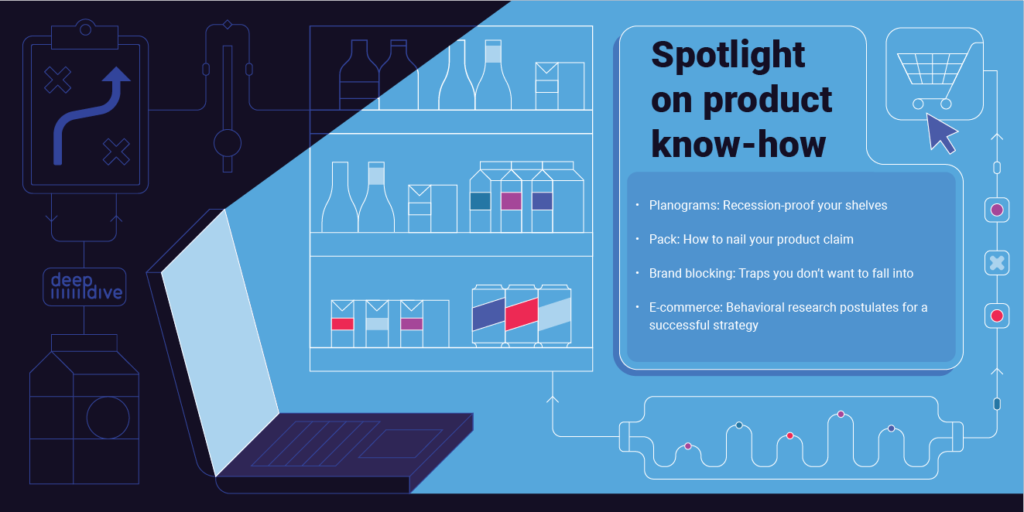
In-depth how-to articles on #planogram, #pack, #brand_blocking, and #E-commerce
Multimedia presentations on tools and research methods, including demos and webinars
Countless insights, statistics, and industry best’s quotes
This can help you better understand:
Behavioral tech-enabled mixed methods frameworks with which you can test your: Pack, Planogram, TVC, Product Claim, Social Media Ads, Online P2P
How to always be on top of the game with market trends and predictions
What answers in-context behavioral mix-method insights can provide you with that sole qual research can’t
How to ask the right research questions for highly predictive insights
How to leverage insight-based knowledge to improve your product, portfolio presentation, and communication
What true consumers’ needs are and how to strategically act upon them
Grab your e-copy of 2024 Insights in Focus! Get in touch via [email protected] and it will soon be in your inbox!
By Minja Stojanov, Internal Business Development Director at EyeSee
As of 2022, the average daily social media usage of internet users worldwide amounted to 151 minutes per day, and Western Europe had a 79 percent social media penetration rate, topping the ranking of global social media usage by region since January 2023, Statista reports say. Not to mention that 81% of people between the ages of 30 and 49 actively use at least one social media site.
Numbers cannot be more clear; social media are officially an integral part of all our lives. They are places where we connect, inform, share advice and experiences, and sometimes even make direct purchases that are available via the emerging possibilities of social shopping. What is particularly interesting is that, recently, Instagram has been offering analytics, even to private profiles.
All of this indicates that there is a strong need for true social media influence to be understood.
Social Media Analytics VS mix of behavioral and traditional testing methods
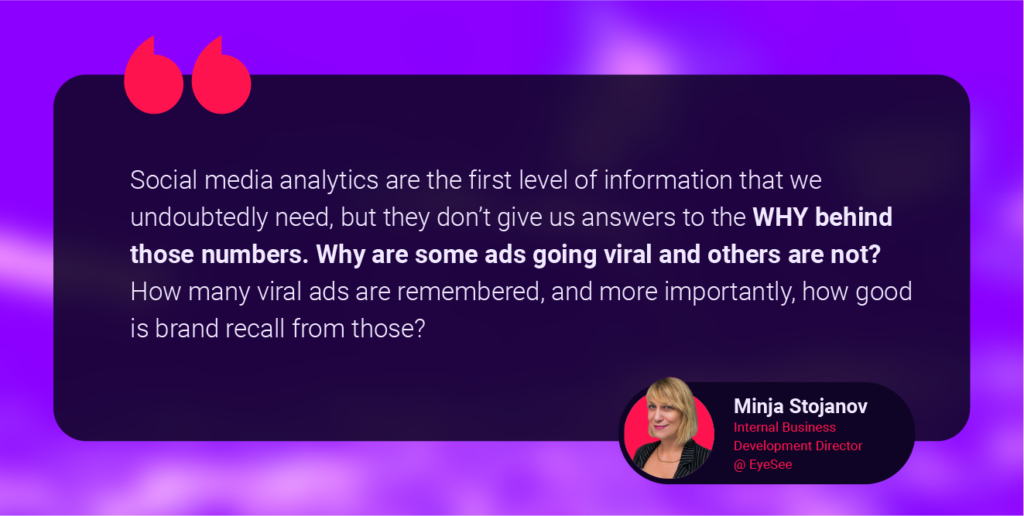
However, are social media analytics sufficient to understand how content affects us and how it works? If we imagine brand managers who are budgeting for content production and strategy for the coming year and want to use analytics to determine the success of previous years’ social media ads, what insights would they have? Are the numbers showing the reach of some ads sufficient to determine whether the audience engaged with the ad or the brand in any way?
For reliable and valid insights, it is crucial to use a mix of behavioral and traditional methods focusing on consumer behavior in the timeline and its impact on sales uplift.
Eye tracking allows granularity into which ad elements are seen and which are often missed. Analyzing the social media heat map is highly beneficial for the placement of key ad information.
Facial coding identifies whether consumers are engaging with your brand by analyzing their emotions through facial expressions.
Surveys help uncover what the ad impact on brand metrics is. When we combine Facial Coding, Eye Tracking and Survey results we get what the true ad impact on consumers was and more importantly WHY.
Virtual shopping provides a direct link between the performance of an ad and in-store purchase behavior with the help of realistic simulated store environments that tap into authentic consumer behavior.
Main KPIs and benefits of replicated media Feeds
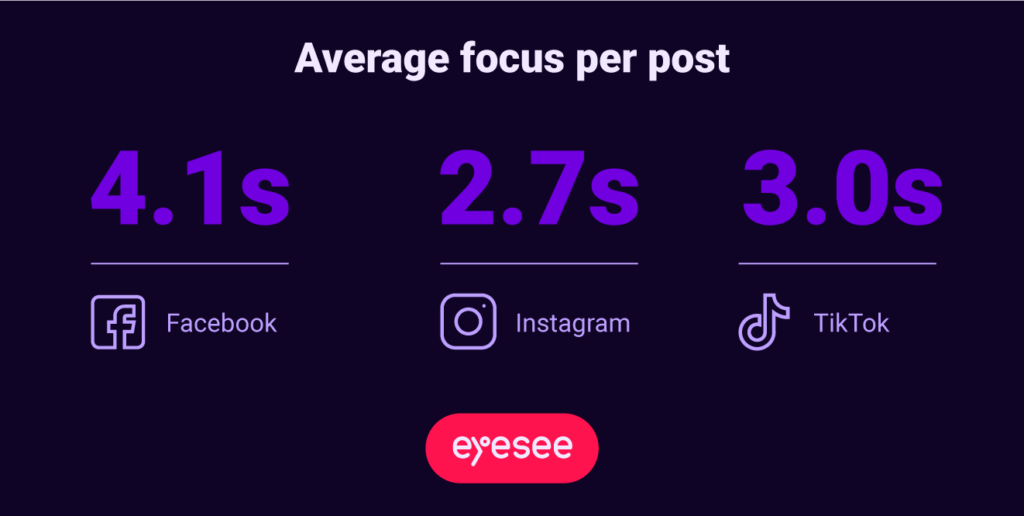
Did you know that people’s average focus per post on Facebook’s timeline is 4.1 seconds, 2.7 on Instagram feed, 3s on TikTok, and that for Facebook and Instagram, there is a 19% decrease in visibility when an ad is lower in the feed?
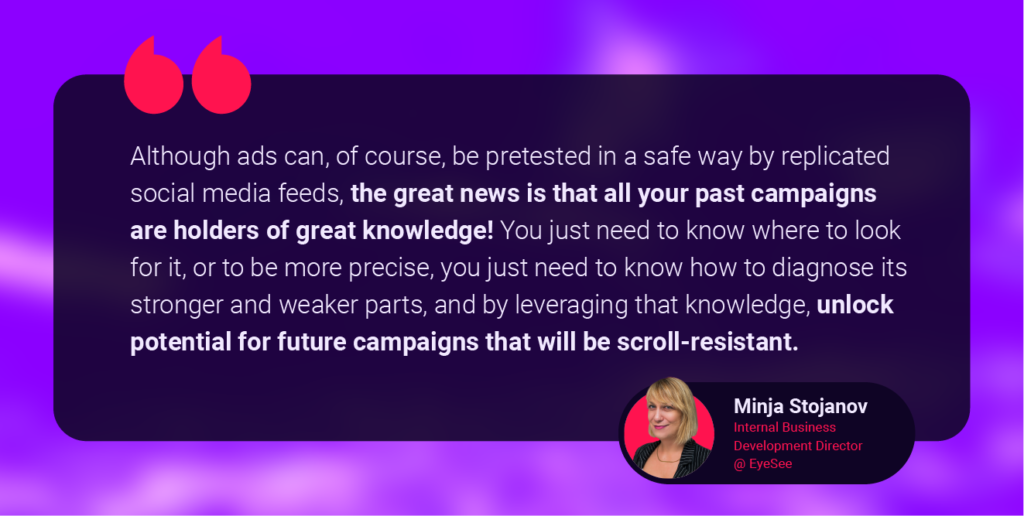
For uncovering the sophisticated differences in behavior that would go undetected with traditional social media analytics, research tools such as replicated social media feeds and the right thought framework are crucial.
That is why here are the metrics and KPIs you need to know about your ad performance:
a) Ad breakthrough:
Visibility – how many users have actually seen your content?
Attention – how long do they watch it for?
Video retention – what are the usual points where you start to lose them?
b) Ad emotional engagement and brand impact:
Emotional reach – is the ad resonating with them?
Survey KPIs – does it fit with the brand, and do users like it?
c) Ad sales impact:
Sales uplift – does the ad impact sales?
Building brand success on best practices and creative guidelines
If we go back to our imaginary brand manager from the beginning of this article, one might rightfully ask: How can I benefit from the knowledge of the campaign that is already done?
Imagine how much time you would save by not having to go back and forth with briefing the creative agencies and influencers but having all the insights along with content recommendations and a set of rules in one best practice playbook.
In conclusion
If you are interested in learning more, I advise you to reach out and ask us for our global study, a meta-analysis of almost 60 ads from 20 brands called “TikTok Global Study: Creative that Works.”. Or you can find a brief overview here and take it from there.
This study gave us, our clients, and TikTok, not only valuable insights and creative guidelines but it proved that social media campaigns are efficient across industries from FMCG, OTC, Personal and home care, and all the way through Durables and in some cases even Financial and other services.
But, no matter the industry, one thing is certain: you want your brand to be where your consumers are, and you want it to be part of their lives. In that process, social media is a crucial component of your brand’s social life among its consumers, and it needs to be done right. A best practice and creative guideline playbook is a tool one needs for that.
November is a special time of year; we summarize our insights and consumer behavior trends, workshop plans, and vision boards for the year to come to pin down the increasingly unpredictable (business) future. My mind inevitably goes back to the first ever bucket list EyeSee made in 2012 even before I joined Olivier and the initial team. The team that won me over with their big idea, passion, and dedication they already put into setting the foundation of what we see today. There was only one item on their agenda; launch a platform that would map the eye gaze using webcam and therefore exclude the need for central location testing.
Although our young core team knew what the goal was, we were yet to understand many things about how the market operates or where we could play our best hand. To say that our initial business strategy needed fine-tuning would be very generous. Thanks to key forward-thinking clients such as Lidl and Smurfit Kappa, we understood that we needed to bridge the technology and insights gap with an integrated offer.
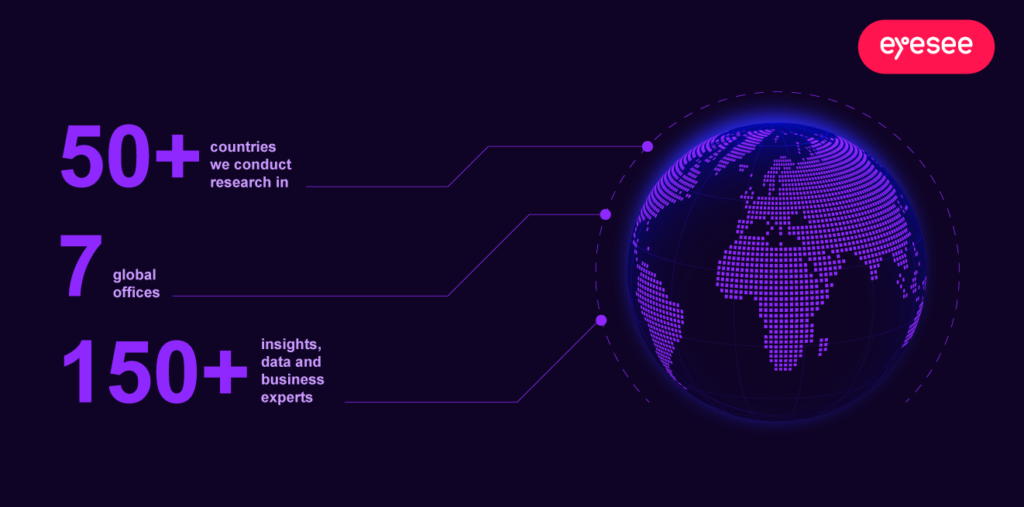
11 years, 150+ team members, 7 global hubs and countless insights projects for leading clients in our key major industries, I find myself at the helm of the organization. The paradox is that I have way more unanswered questions now than I had in 2012, I’m empowered by the knowledge we’ve picked up as a team along the way. Our strategy is clear and still follows our initial compass of combining scalable behavioral methods.
Reflecting on our path to sustainable growth, here are three crucial lessons. May these insights inspire and ground your journey to expansion!
Big idea? Innovation is a marathon, not a sprint.
In 2012, Olivier Tilleuil (EyeSee’s founder) reflected on different consumer research approaches and noted two things.
Firstly, most shopping decisions are made in a split second and subconsciously; however, the go-to framework for researching these decisions were explicit methods. In most cases, respondents are not able to verbalize feelings or reasons behind their decisions, so it’s no surprise that surveys ended up being effective in predicting consumer behavior 6 out of 10 times; a little better than rolling the dice.
Secondly, methods measuring behavior such as eye tracking (mapping the eye gaze) or facial coding (mapping emotions) gave higher predictivity but were cumbersome and commercially inaccessible.
Developing online Eye Tracking was our first major win which solved the challenges Olivier keenly observed. Very quickly after, while working with our first clients, we were pushed to go beyond eye tracking – facial coding, interactive shelves, and many more methods were launched to meet the research needs of those determined to stay on top of the market.
Innovation doesn’t stop with the big idea; rather, it is more like an initial bang that will start the chain reaction of transformation and innovation. If it doesn’t provide that “big bang” one may ask, was it a real big idea in the first place?
Trust your instincts in picking partners
After our big idea and initial growth and development that led us to travel overseas and open an office in New York, our desire to improve remained strong. However, sometimes, especially when growth is rapid, companies require the assistance of true allies and visionaries. Someone who sees all the possibilities while keeping a bigger picture in mind.
In our case, that kind of validation, support, and knowledge came from the main investors, ING Corporate Investments, and Smartfin , who acted as our strategic financial partners.
The capital raised was resourcefully invested into building an R&D team, expanding our commercial and operations teams, revamping our organizational structure based on multidisciplinary client pods with agile support teams and opening new markets. We ended up operating on four continents and providing insights in50+ markets, thanks to our openness and the vision and faith our clients placed in us. We expanded and opened new offices in Mexico and Singapore, all while dealing with a global pandemic. Such results wouldn’t be possible if we were in it alone.
The partnership was grounded on these solid pillars; trust, and a curiosity for developing new tech that would enable us to take the unbeaten path.
When in doubt, always set your course forward
While looking back is grounding, a more important question is – what’s next? If priorities need to be set – what serves the future, as opposed to what we are doing now? For EyeSee in particular, we plan to continue leading the social media insights game. Our massive collaboration with TikTok in 2023 resulted in the largest behavioral study done on the platform; by testing 60 ads by 20 brands across categories, we were able to discern creative guidelines.
Cultivating technology is part of our company’s DNA so, for example, it is not surprising that we have released deep learning instead of a machine learning based algorithm for our Eye Tracking methods. Obviously, we are taking that forward across platforms to Mobile. We are also developing a Client Collaboration platform so that our operational efforts can progress smoothly and make insights for our clients more easily accessible with as little friction as possible.
All these priorities are directly inspired by our clients’ needs. Client-centricity is not only healthy but a key ingredient of success. Stop, listen, collaborate and iterate; it will make you ten-fold better. So, in the future, I see an amazing team of multidisciplinary talented individuals sharing curiosity and eagerness that we are today, to keep making a difference in the exciting market research space of tomorrow.
Interested in diving deeper into consumer behavior knowledge, tune in and follow our podcast you can acquire here.
To make some kind of system in such a branched shopper movement and try to be as predictive as possible, keep these five things in mind.
Map the market
In an average supermarket that contains around 50k SKUs, consumers spend only 5 seconds per aisle, while EyeSee’s data shows that online shoppers browse the product list page between 15 and 20 seconds searching for the right item. These numbers tell us that competition is fierce and attention spans are challengingly short; every product touch point counts, whether it is in the online or offline world. So the first thing you want to do is map the market by asking these questions.
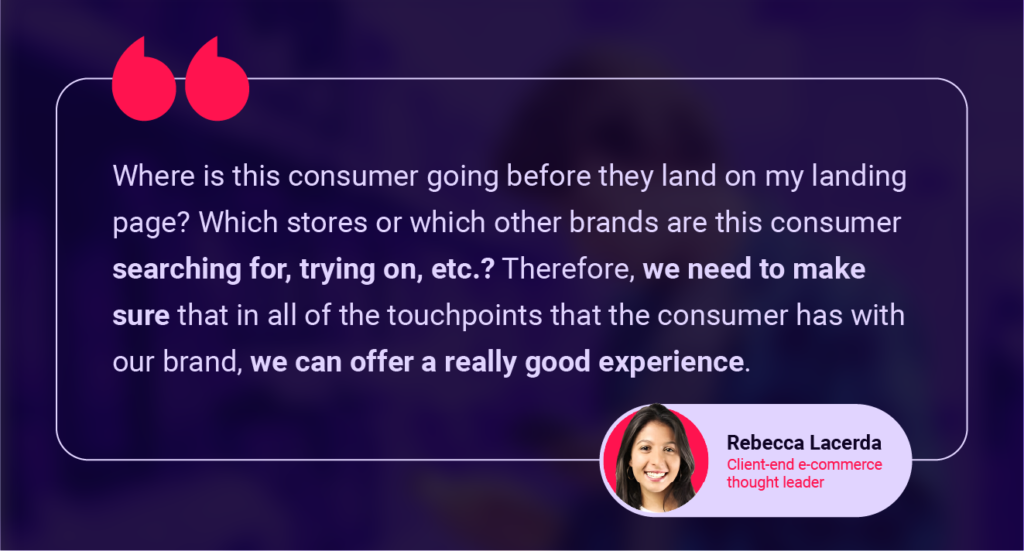
Who is this consumer? What are the consumers looking for? What are the relevant players in the segment or industry I’m playing in? Who are my competitors? Which are the platforms that will complement the assortment that I’m offering or the service or experience that I’m offering through my platform? And then, how are those players positioned in terms of pricing, brand positioning, brand potential, et cetera? You may not have all of the answers right away, but as you begin to research the market, answers will emerge one question at a time.
Never lose sight of the bigger picture
One thing that we should bear in mind is that when we are thinking about online and in-store consumers, we are talking about the same people. This whole separation that we do between online and offline as if they were completely separate worlds is not very accurate because nowadays what we have is a hybrid experience with a hybrid consumer who many times researches or searches for the product online already knowing that they will buy offline, or the other way around.
When we accept an in-context holistic approach can we position our product in the e-commerce market correctly. Only a few people end up clicking on the ad itself (2%), so do not expect your revenue to increase from ad conversion. The way the ads influence the shoppers is that they subconsciously drive interest in the advertised product, which then gets purchased on its primary position i.e. the list. However, this does not work for all products and all categories equally. An uplift in brand purchase can be as high as 40% for different categories, but as low as non-existent for others. To find out more about it read our Leverage ads in online shopping: Amazon Fresh behavioral study.
Be present at the key touchpoints
If we look only at the online consumer movement, we can see that it is far from linear. Passive tracking is the predictability tool you need. It helps to understand not only the consumer’s motion but the keywords of consumer language too. It answers key questions
Which touchpoints are most frequently visited?
What is the typical number of visits?
Where do visitors come from?
Where do they land on the retailer’s website?
Having these answers means you will be able to wisely direct communication, pick the right product placements, and make the ROI certain. There are four stages of passive tracking set up:
Defining all the keywords relevant to the category of interest
Programming the study and implementing all the relevant keywords
Gaining respondents’ consent to pull their browsing history
Pulling browsing history for the analysis, including any predefined keywords
It can be applied throughout 30, 60, or 90 days. Along with Eye Tracking, Surveys, and Path to Purchase, buying your product will be the final customer destination, no matter the road they take.
When a consumers are on your landing page, make sure not to lose them
Around 70% of e-comm shoppers abandon the cart without completing the purchase, and there are many reasons for that – maybe they just investigated online and will shop offline; maybe they need more time to decide; but it can also happen that the process of checking out is too complicated and not easy to understand, so by fixing it, you directly increase conversion rates.
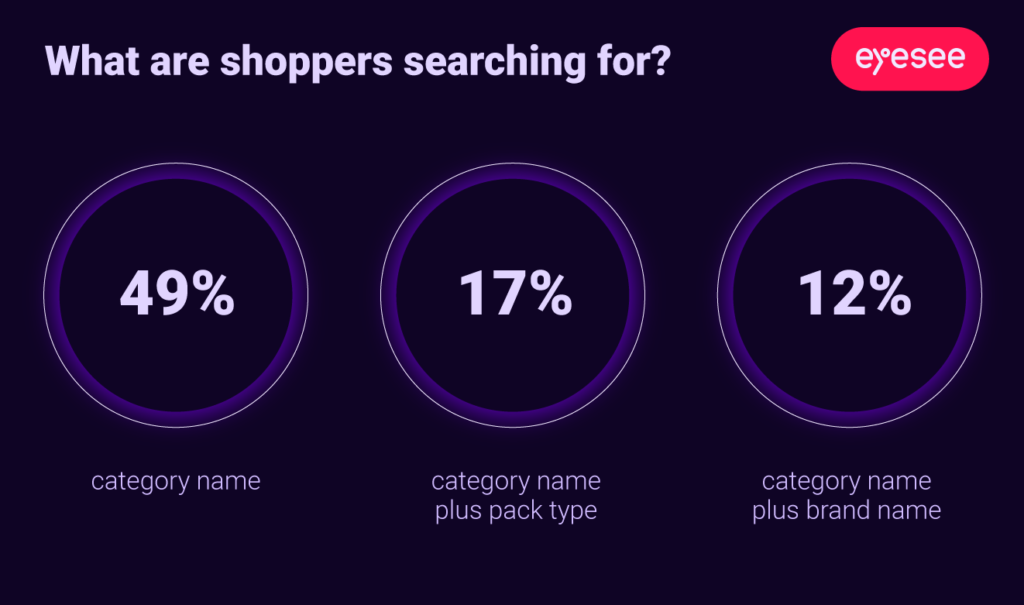
Did you know that when shoppers search for a product 49% of them search category name, 17% of them search for category name plus pack type and only 12% of them search for category name plus brand name. Test the path to purchase shoppers’ behavior.
In EyeSee we track how a person navigates through the live page (so it’s a real behavior, or as close as it can be), and we also expose consumers to some relevant static pages, usually a Product Listing Page (PLP is similar to a shelf in a regular BM store, it’s just much more cluttered and pictures of products are smaller; imagine a PC or mobile screen with a list of hundreds of products that you scroll through) and Product Details Page, but it can be anything else, such as Search Result Page, Add to cart/Checkout process, A+ Premium content (or any Promo content), whatever we think might be relevant to investigate or have indications it might be a bottleneck. On static pages, we want to know where consumers’ attention goes, for how long, and how visible or engaging the products and website elements are.
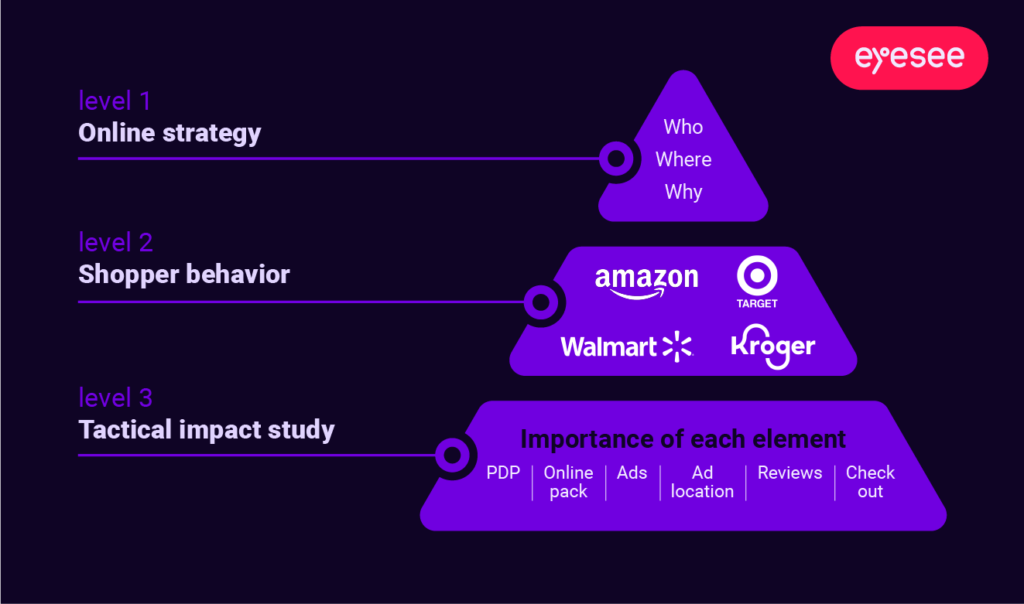
When top to bottom isn’t an option, reverse it
Most commonly, managers choose a top-down approach: to start first with a strategy to identify who our online shoppers are, where they search for our product, and what the drivers are for choosing specific channels, then move to testing shopper behavior and the path to purchase on specific details, and then, in the third level, test tactical marketing assets like ads, packs, banners, standard pack versus hero image, reviews, and checkout. However, sometimes it might be a good idea to take a bottom-up approach. This is the case when you don’t have a firm digital strategy yet but, for example, want to get some quick wins. You want to showcase that digital testing makes sense and that you can have wins in terms of conversions, a smoother consumer journey, and a better consumer experience. So, for example, you can test the Regular Pack versus the hero image pack, and here, you can show your departments and your wider team that the hero image performs significantly better in terms of conversions, sales uplift, and brand uplift. This is an advantage to use to get more backup to do wider-range service and maybe even create a complete digital strategy.
In the previous article, we already stressed the strong impact that TikTok has on consumer purchase decisions as well as the reach that sponsored content can have if done properly.
The figures speak for themselves:
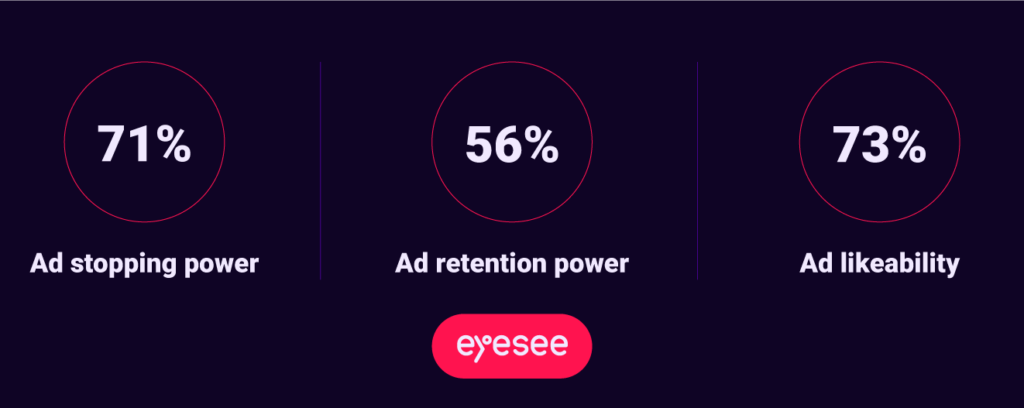
71% of TikTok users stop and watch the first three seconds of the video
56% of each sponsored piece of content is seen on average
73% of TikTok users like the ads that they see
As we explained, we tested 60 ads from 20 brands across markets and industries such as FMCG (Fast Moving Consumer Goods), Beauty, Insurance, Fashion, Technology, Automotive, Retail, etc. TikTok simulations, standalone ads, and surveys were tested among 7280 respondents. All of the respondents were TikTok regulars who had purchased items from some of the categories in the previous six months. You can request the study walk-through at [email protected]
Universal Robina is a great study example since their FMCG portfolio is impressive, and they turned out to be one of the winners in the game of TikTok. Let us take a closer look at the testing process and the outcomes.
What works better: native versus heavily branded approach
When it comes to ad style, brands typically choose between two options. They either create a single video and distribute it across all platforms, even though each platform has its own set of rules, or they assume that the native approach will win. Of course, creating a single video for multiple platforms is more cost-effective, but the native approach yields better results on a specific platform. However, both of those theories have their ups and downs, and the key is to test them, preferably in a simulated digital environment. By using natural and unforced exposure of the stimuli in an environment as close to reality as possible, we get an objective and accurate insight into the actual ad visibility.
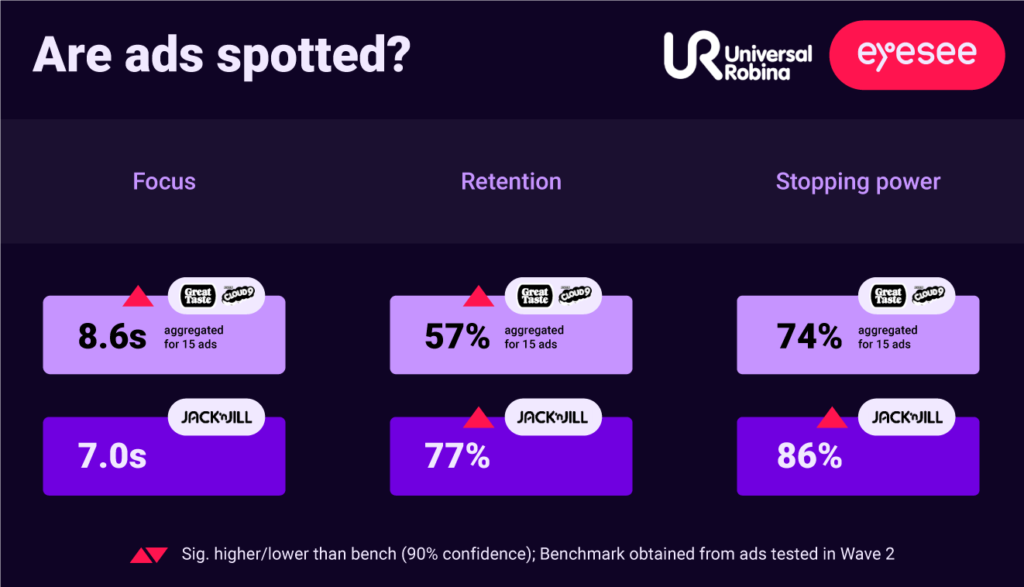
In the TikTok simulation, respondents saw three videos: an advertisement for Great Taste, Cloud Nine, and Jack’n’Jill. We also consider the focus (time spent on the screen), retention (percentage of people who watched the video), and stopping power (percentage of people who stopped to watch the video) of tested ads.
Great Taste and Cloud Nine ads performed better than Jack’n’Jill in terms of focus, with 8.6s vs 7s; however, because Jack’N’Jill used a more native organic approach, it performed better in terms of retention and stopping power. (77% vs 57% and 86% vs 74%).
But does this necessarily imply that Jack’N’Jill performed better in terms of brand visibility? Not necessarily. With the organic approach, there is always the risk that the video will be insufficiently informative and that the key message will be missed.
What prompts TikTokers to recall brands more?
It is important to note that not only are all three tested stimuli different in style, but they also place the product in a different place in the timeline. Great Taste and Cloud Nine commercials have great dynamics and upbeat music, and the Jack’N’Jill approach is more raw and native; however, both approaches scored good brand recall, with only 2% of the difference in favor of Jack’N’Jill (74% vs. 72%). The key finding, however, is that watching the entire video increases brand recall by 35% compared to viewing only half of it.
Key findings
Universal Robina ads performed extremely well, so one of the key takeaways is that they should maintain TikTok content style while also maintaining their core brand attributes. They succeed in keeping users’ attention by using upbeat music and video dynamics, and they get their message across.
Oversimplification of the video should therefore be avoided. Because user attention is difficult to maintain, quick changes of scenery rather than just one setting are preferable. And, as previously stated, a native approach is not without risks, so whether it is appropriate for your brand depends on the strategy and campaign goals.
However, to see the full results of the Universal Robina study and to learn more about post-pandemic shoppers, watch the video below. There you will find the full presentation that debuted at the Asia Research Breakfast, which we were fortunate to attend as guest speakers. Also, don’t forget to acquire the whole study walk-through at [email protected]
Interested in reading more about global TikTok study? Click here.
TikTok is an undeniably influential social media platform with significant untapped potential for sponsored content. Following the pandemic, our habit of using TikTok remained strong. The app enjoys one of the highest user retention rates globally. An incredible 81% of users say TikTok videos influenced their recent purchases. That is why it is becoming increasingly important for brands to understand how to create effective ads that resonate with their consumers.
According to our most recent two-wave global study, we discovered that 71% of TikTok users stop and watch the first three seconds of the video and that 56% of each sponsored content is seen on average. All of this is supported by the fact that the ads are liked by 73% of TikTok users.
These figures show that sponsored content has every reason to thrive in TikTok’s digital environment. However, brands are still not using their full potential. This study not only invites you to use TikTok to empower your brand, but it also gets deep into what you must keep in mind while doing so. If you are interested in getting an expert walkthrough of the study, write us at [email protected]
Methodology
As previously stated, we tested 60 ads from 20 brands across markets and industries such as FMCG (Fast Moving Consumer Goods), Beauty, Insurance, Fashion, Technology, Automotive, Retail, etc. TikTok simulations, standalone ads, and surveys were tested among 7280 respondents.
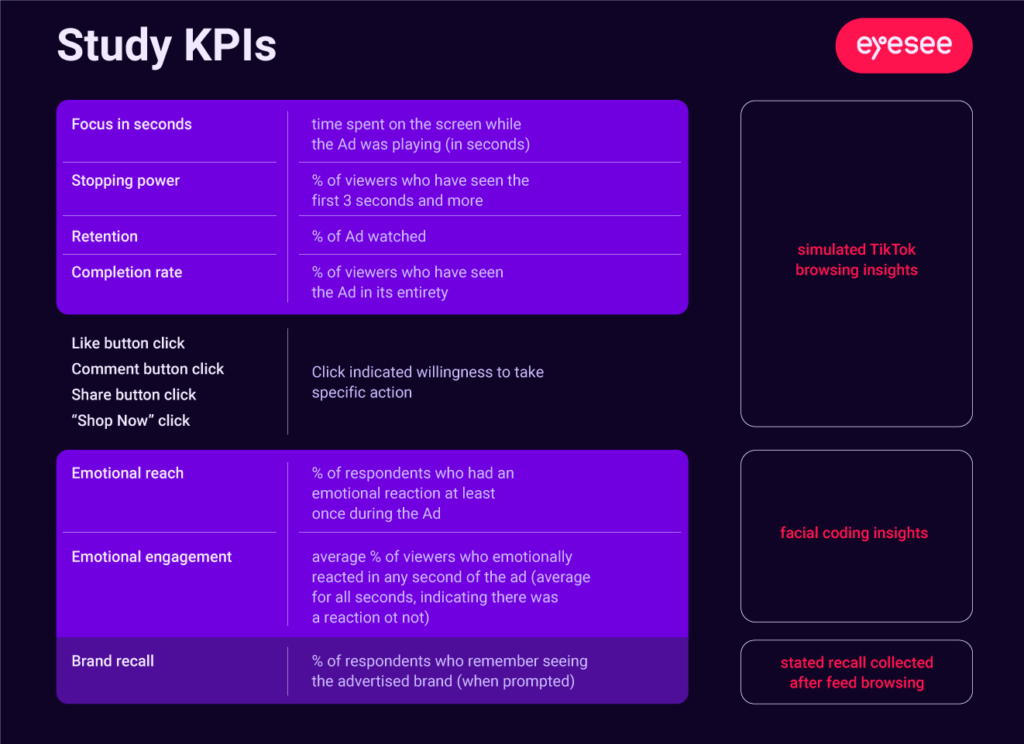
This research is built on the following key pillars:
Ad stopping power (tested the ads in a simulated TikTok environment that provided us with browsing insights)
Ad retention (tasted by exposing respondents to a simulated TikTok environment)
Ad emotional reach (tasted by exposing respondents to standalone ads and utilizing face coding methodology)
Ad likability (tasted by exposing respondents to standalone ads and utilizing face coding methodology)
Brand recalling (to learn % of respondents who remember seeing the advertised brand when prompted, we used the survey method)
The challenge of TikTok advertising
Why don’t brands use TikTok more? This is the imposing question that arises when we look at the numbers that show the untapped potential. On one hand, we have the answer that for brand managers, it is hard to follow the ROI once they invest in TikTok ads. They are unsure how to follow the path and make a clear connection, or better to say, they are unsure how to follow the path to purchase from the TikTok ad to the shopping cart.
On the other hand, even when clarity in that field is gained, the questions of how to approach strategy and what works best remain. There are questions about what will work better – the native approach or strongly branded videos that will also work on other platforms; what is the reach of animation as the dominant style; and is co-branding the way to more followers and engagement or the way to poor brand recollection?
This study answers all those questions and beyond. For example, animated video ads, those containing any kind of computer-generated imagery, will improve brand opinion by 23% and increase brand interest by 19%, while elevating the positive emotions about the brand by 20%.
However, brands must be careful; there is a chance that they will be seen as less informative than conventional videos if the message and narrative in them are not constructed carefully.
The golden rule for unlocking the untapped potential
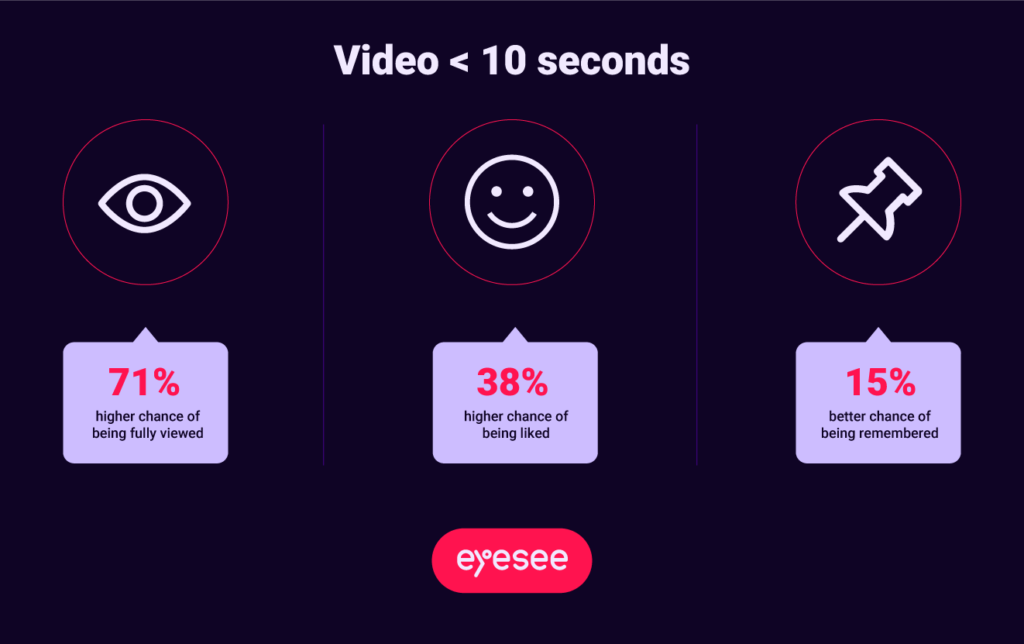
What is great about this report is that it contains a lot of simple facts that must be considered in future ad planning. For example:
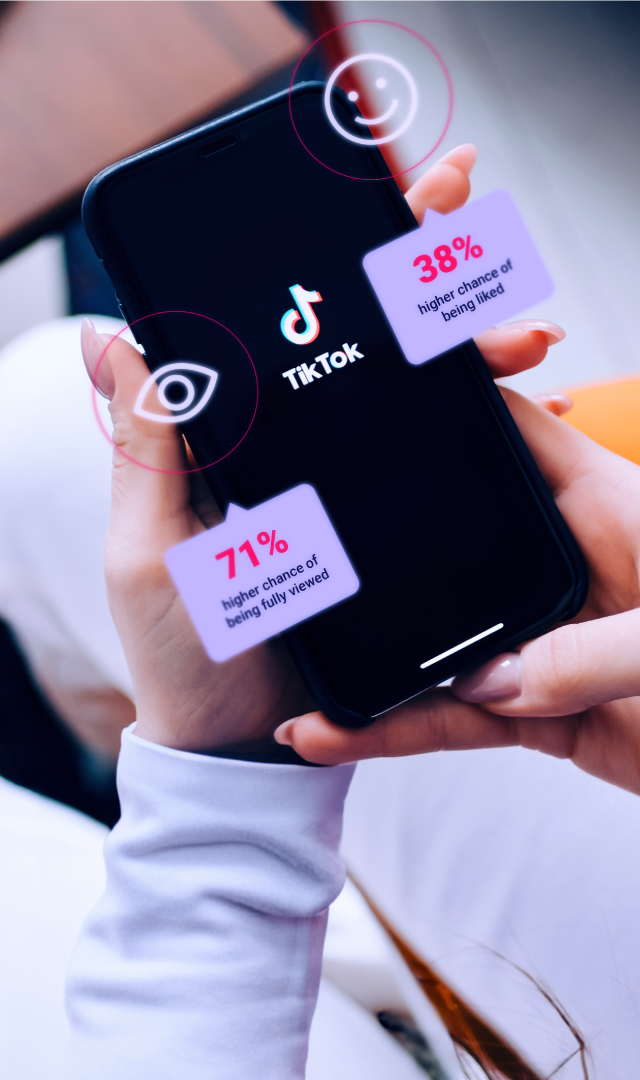
If the ad lasts up to 10 seconds, it has a 71% higher chance of being fully viewed.
A video that lasts up to 10 seconds has a 38% higher chance of being liked.
If the brand lasts up to 10 seconds, it has a 15% better chance of being remembered.
This is an example of an insight finding that makes a strong recommendation that is universal around the world. However, in this report, there are far more complex recommendations that necessitate a thorough examination of both specific brand values and the TikTok environment.
All of this is only the beginning. If you want to learn more, send an email to [email protected] and we will provide you with a video expert walkthrough of the study. Not only will you get the big picture and the future framework for making strategic TikTok ad planning decisions, but you will also be able to formulate specific questions for your specific pain points, which we will gladly assist you with.
Request access to
TikTok creative study findings!
Eager for more? Read the blog about replicated feeds for authentic behavior here.
By Jason Bradbury, Senior Client Service Director at EyeSee
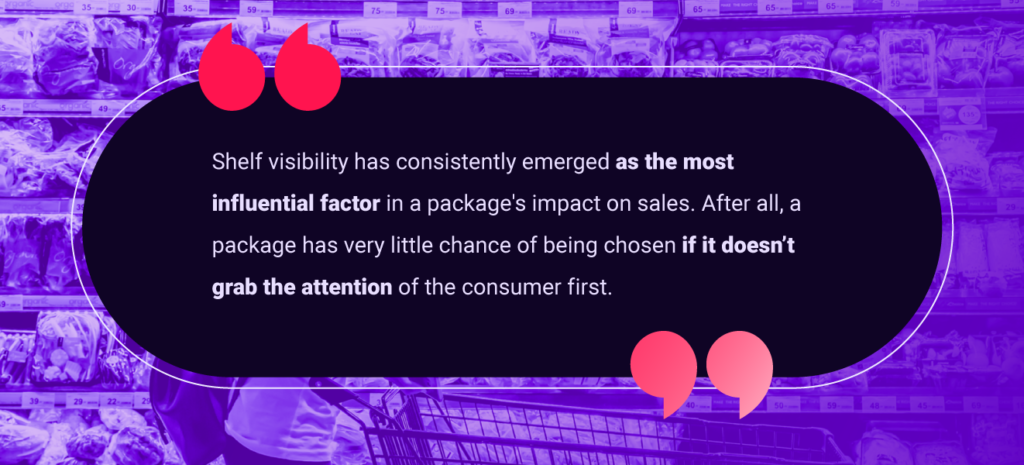
As insights professionals, our understanding of observed shopper behavior (rather than claimed or rationalized response as captured though traditional survey research) is paramount to the success of packaging design strategies. According to ongoing research, up to 95% of consumers make purchase decisions in just a matter of moments while standing in front of the shelf. They rarely engage in time-intensive comparison-shopping; after all, an average supermarket has upwards of 50,000 SKUs! This underscores the importance of designing packaging to excel at the “first moment of truth” to drive market success.
How then do you identify the crucial parameters for evaluating the success of a package? In this article, I provide a step-by-step walkthrough of a mix of KPIs that have been proven to accurately predict the best pack designs.
Visibility: The gateway to consumer engagement
To address this, it is crucial to understand the physiological aspects that influence visibility, such as packaging colors, graphics, and structures that disrupt the shelf environment. An additional point to bear in mind is that smaller brands or new product innovations often do not obtain optimal shelf placement (arm and eye-level placement) and thus may need to work even harder to attract attention. Advanced technologies like the proprietary Eye tracking solution EyeSee employes provides valuable insight into how packaging draws consumer attention, enabling us to quantify its performance from a behavioral standpoint (rather than relying on ambiguous and less certain claimed recall metrics).
Findability: Promoting product location and seamless line navigation
Shopper confusion is detrimental to successful packaging. With limited time and cognitive resources (and the sheer effort required when shopping dozens of categories beyond just “your” specific one on a typical store trip), shoppers prefer products that are easy to locate and that minimize the time spent in product pursuit.
Effective shelf presentation, clear differentiation of product varieties, and leveraging visual brand equities all help contribute to easy and efficient product line navigation. By using behavioral research to understand how packaging affects findability accuracy and search time, we can identify potential risks and opportunities for improvement prior to introducing new designs or products to market. As contextual considerations are key to understanding shelf navigation, incorporating shelf-based metrics into testing is critical for gaining a comprehensive understanding of packaging performance.
Consideration: Using communication to inspire consumers
Packaging serves as a powerful communication tool, inspiring consumers to choose specific products or brands over all others. This is especially important for new products as only a select few receive communication support at product launch.
Effective communication creates a compelling connection that drives consumer consideration. Through innovative online testing methods like EyeSee’s implicit Reaction Time communication exercises, we can evaluate how well packaging conveys key product details and motivates consumer behavior. Combining rational metrics with extensive behavioral insights enriches our understanding of long-term communication impact.
Conclusion
As consumer insights professionals, harnessing the power of consumer behavior is crucial for optimizing packaging strategies. By focusing on 1) visibility, 2) findability, 3) communication, and 4) measuring behavioral responses, we can unlock valuable insights into packaging performance. Armed with these insights, professionals can shape strategies that resonate with consumers and drive brand success in a rapidly evolving marketplace.
Want to know more about pack optimization? Dive deeper and learn how to choose successful claims!
Emotions build memories and drive action, which is why they hold a special place in advertising. Brands rely on emotional marketing to gain a competitive advantage within each step of the consumer journey – it drives the brand’s audience to notice, remember, share and, ultimately, buy the product or service.
And although there is no doubt that successful ads create an emotional connection with the viewers by relying on emotional marketing, the emotional appeal is only one part of that success. Ads should also be relevant and bring a sense of novelty (both of which lead to higher attention and memorability). So, to deem an ad successful, we need all parts of the pie, which we can easily achieve by ensuring that survey, RTM, eye tracking and retention are combined with facial coding.
So, here’s your guide to everything you need to know about facial coding!
Anchoring: Associating emotions with the brand
Besides complying with consumer journey stage-specific objectives, advertising has an opportunity to anchor positive emotions to the brand. Anchoring goes beyond the first impression bias; it is stable and fluid enough to be both relevant and manageable. Some of the biggest brands’ primary principles in advertising focus on selling abstract positive concepts such as happiness, excitement, and security while, simultaneously, training our brains to associate the brand with those emotions. Nevertheless, anchoring can work both for, or against, the brand so it’s important to be aware of it and know how to leverage it. Ultimately, in order to correctly plant an anchor, advertisers need to make sure they know which emotions are evoked by the ad and in what particular context the emotion of interest peaks.
Explicit vs. implicit research methods: Stated input alone isn’t enough
Explicit vs. implicit methods. When evaluating people’s preferences and judgment on some specific content, the most reliable way to do that is by observing what they do (how they behave), instead of relying solely on what they say. Getting feedback is never an easy task for marketers, especially when it comes to the target group’s attitudes and beliefs – let alone emotions. Respondents may not be able or willing to share their likes and dislikes; moreover, they are unlikely to remember their emotional reaction to the stimulus after the exposure or even be aware of it during the exposure. Furthermore, likes and dislikes are intrinsically emotional concepts which is why an emotion-centric method is the best fit here. In line with that concept, facial coding proxy solutions like “emoji analysis” are just as misleading as a verbal response, as they still depend on the respondent’s willingness and capacity to share their opinion – they are symbolic rather than verbal, but still remain explicit and voluntary in nature. Besides having a subjective experience (1) and physiological dimension (2), emotions encompass a behavioral component (3) too. Behavioral component is mostly automatic and involuntary;this is especially true when respondents are tested individually/isolated from social settings because, when grouped, and particularly if an authority figure is present, people are more likely to manage or mute some of their facial expressions.
EyeSee’s study prerequisites (i.e. remote testing, FC and ET calibration that allows for only one person at a time) make respondent participation an individual experience thus allowing automatic and involuntary nature of facial expressions to take place. This results in facial coding being the most objective method when it comes to assessing the audience’s emotional response to advertising efforts. And though there are other implicit methods that yield insight into emotional experience (like EEG and fMRI), facial coding is undoubtedly the most scalable (tests are conducted online) and the least intrusive one when it comes to marketing research (there are no wires attached, respondents sit comfortably at their homes during the test). In order to participate in a facial coding study, respondents are required to provide facial coding consent, and according to EyeSee’s internal research, there is no statistically significant difference within the respondents’ demographics (age, gender, ethnicity, education level, income, employment and marital status) between those who consent to facial coding and those who do not, the fact that further ensures the feasibility of the solicited sample distribution for our client’s studies.
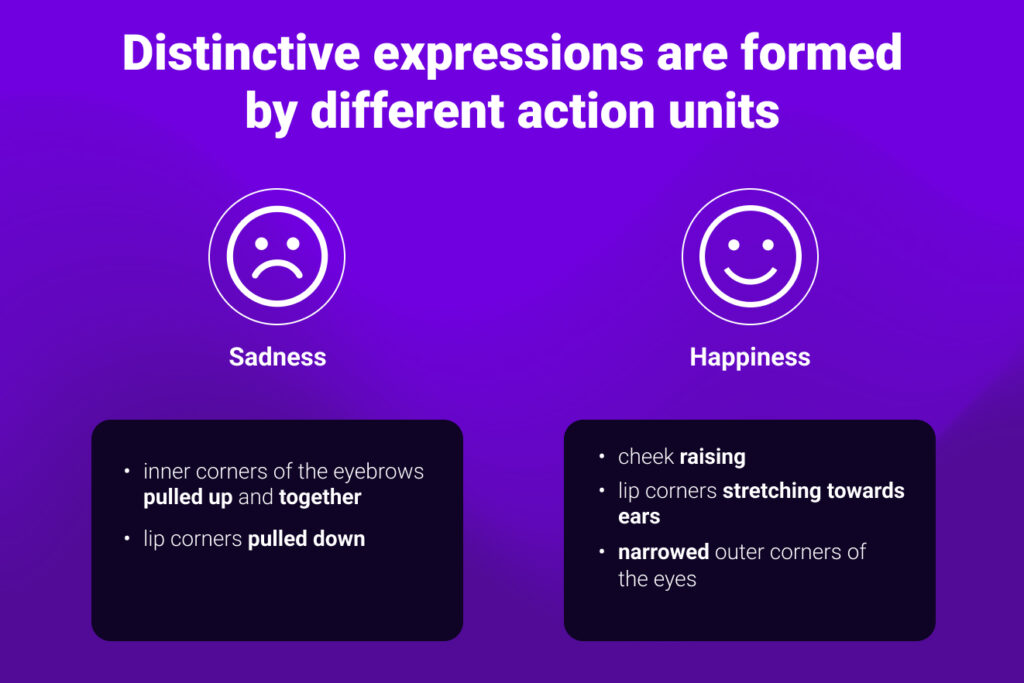
How facial expressions are scored: FACS
We are all facial coders – as species, we rely on one another for survival and wellbeing, and it is very important that we can quickly look at someone’s face and evaluate how they feel so we can navigate our interactions with them. But how can we come to a consensus that we are talking about the same expressions and identifying a smile as a smile? In order to standardize descriptions of facial muscle movements, Paul Ekman constructed the Facial Action Coding System (FACS), a tool for the classification of all possible facial expressions that humans can have. In this comprehensive system, each component of facial movement is called an action unit and all facial expressions can be broken down into action units. Together with W. Friesen, he identified 46 different units able to describe each facial movement.
EyeSee’s emotional framework, which relies on Paul Ekman´s FACS[1], is comprised of 5 basic and 2 cognitive expressions:
1. Basic emotional expressions: happiness, surprise, dislike (an umbrella category for disgust, contempt, and anger), fear, sadness
Besides basic emotional expressions (happiness, surprise, disgust, contempt, fear, sadness, and anger), which are commonly found in behavioral marketing research companies which utilize the facial coding method, EyeSee’s framework also includes cognitive emotions (interest and confusion). Cognitive emotions are an important addition when it comes to understanding how attention is managed and knowing how to optimize it during the ad. Interest is a cognitive emotion that inspires learning and engaging with new things (stimuli and experiences) and willingness to further explore the product or service. Overall, it positively influences attention given to the content, whereas confusion mainly has the opposite effect – people withdraw their attention and “decide” to spend their brain power on something else. Finding something understandable, however, is the hinge between interest and confusion – new/complex and comprehensible things are interesting; new/complex and incomprehensible things are confusing (Paul J. Silvia).
Transforming facial coding data into insights
Emotional experience behind the emotional expressions is a level to be tackled in the interpretation phase, by combining facial expression and stimulus, or, in other words, when providing facial expression with a context. In context, happiness can be interpreted as relief or sympathy, surprise as awe, contempt as disbelief, and disgust as discomfort; some expressions, like a frown, can even be neglected in the interpretation phase if its very peak corresponds with a scene with excessive light shift in the stimulus. Supported by survey analysis and eye tracking, we can further match the nuance behind the labels.
Which emotions is the creative team after? Intended emotional outcome and its repercussions on interpretation
Remember Burger King’s “Mouldy Whopper” ad? It’s a bold commercial designed to provoke disgust in order to make a point while at the same time skyrocketing its memorability: the burgers rot over time because they are organic, and organic means fresh – no artificial preservatives. Depending on the ad’s narrative, negative emotions like disgust, contempt, sadness, and fear can be a part of creative objectives. While it may seem counterintuitive to intentionally trigger these emotions, they can be powerful drivers of action, especially if your product or service offers a solution to them. This is why valence-based approaches, which limit themselves to positive and negative emotion-oriented KPIs, are to be taken with reserve; they are less explanatory when used alone without emotional profiles since they do not take into account that emotions of the same valence differ in essential ways. Furthermore, “roller coaster” narratives demand negative emotions for the positive emotions to take place – e.g. In order to elicit relief, you first need to elicit fear. It comes down to this: interpretation greatly depends on the emotional marketing strategy behind the creative’s narrative.
Benchmarks – Compare apples to apples
When assessing an ad’s performance on an emotional level, providing relevant benchmarks is a must. Stimuli of different lengths attain different levels of attention and allow for different emotional engagement to be developed. The same rule applies to creative solutions (e.g., is the stimulus’s creative solution more a collage or movielike?). And although a global benchmark is a good fit in many cases (with the right lengths and stimulus solution), for some studies it is best to apply a culture-specific benchmark (i. e. for a study conducted in Japan, an “Asian benchmark” would be the best fit). In conclusion, it is essential to consider both sample and stimuli specifications when conducting significance testing and an extensive benchmark base allows EyeSee’s research team to do that, thus reaching reliable conclusions.
Afterthoughts
Behind some of the most successful brands is an emotional marketing strategy consistently conditioning our brains to associate the brand with positive emotions. These associations play a particularly important role when rational discriminative factors like price and product specifications are missing (i.e. when there is no apparent difference between price and product/service specifications among competitor brands). Being both the least intrusive and the most scalable method, facial coding serves as a window to honest feedback on emotional engagement, thus allowing creative teams to answer the following questions:
Does the message / visual / narrative resonate with target audience on the emotional level?
Is the content creating the intended emotional state?
Which are the most engaging parts of the stimulus?
Where are the emotional peaks?
Based on 1-4, what are the learnings and how can they be leveraged to design narratives that bring brands closer to their audience?
Are you looking for more methodology knowledge? Check you this blog about retention measuring!
[1]The Facial Action Coding System (FACS) is a comprehensive, anatomically based system for describing all visually discernible facial movement. It breaks down facial expressions into individual components of muscle movement, called Action Units (AUs); Ekman, Paul; Friesen, Wallace, FACS, 1978.
With Women’s history month coming to an end, let’s dive into the second installment of the Women that shape research (and us) series. This time around, our top experts and impressive women selected breakthroughs about buying behavior that define the current moment.
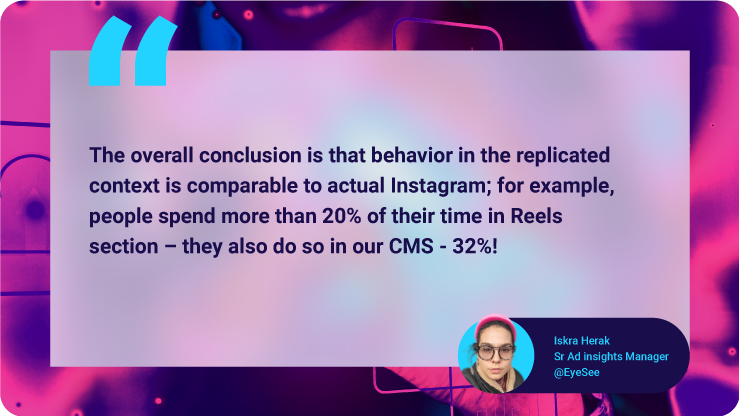
Instagram done right
Testing in replicated environments is becoming the new standard for breaking down authentic consumer behavior; especially the complex and often elusive link between scrolling and buying. A validation study that was just completed set out to compare how consumers act in recreated Instagram feeds and reels for testing versus the actual Instagram app – here’s what we found.
Here’s an overview of other top findings:
Positioning matters: Ads that show up in the first 12 posts on the feed have up to 50% more visibility.
Visibility is not the same as memorability: Lower brand recall (29%) occurs even with the visibility is as high as 70%
Long ads are not Insta-friendly: You can lose ~85% of your audience in less than 5s
Social buying pushes the market research to do better
The social apps in China evolved to encompass all aspects of the consumer journey, including services such as delivery & in-app supermarket services, and retail search engines; they are an integral part of not only every facet of shopping, but everyday life.
Given the proliferation of e/social commerce, clients are looking to test how their concepts fare in the context of very particular platforms. For example, assessing the specificity of TikTok formats and developing platform-specific best practice gives you a clear competitive edge.
How much freedom is too much?
The crisis of recent years really brought home how resilient, flexible, tough, and above all adaptive we all are – just look at the evolution of online services.
Research by Global Web Index reveals that 1 in 5 internet users across 20 markets will be looking for more flexible payment options in the coming months – everything from free cancelations to refundable options improves shopping experience and potentially increases turnover. The key challenge for brands now is to strike the right balance with flexibility, and not overwhelm consumers with choice in order to discourage final cart dropout.
Make sure to check out the first installment of the series where top talent from Mexico shared their insights!