Tap into hidden potential with new TikTok creative insights

TikTok is an undeniably influential social media platform with significant untapped potential for sponsored content. Following the pandemic, our habit of using TikTok remained strong. The app enjoys one of the highest user retention rates globally. An incredible 81% of users say TikTok videos influenced their recent purchases. That is why it is becoming increasingly important for brands to understand how to create effective ads that resonate with their consumers.  

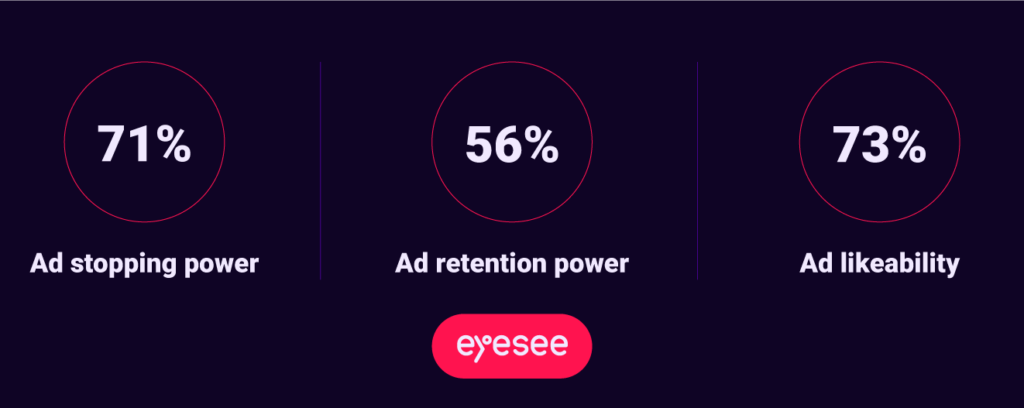
According to our most recent two-wave global study, we discovered that 71% of TikTok users stop and watch the first three seconds of the video and that 56% of each sponsored content is seen on average. All of this is supported by the fact that the ads are liked by 73% of TikTok users.

These figures show that sponsored content has every reason to thrive in TikTok’s digital environment. However, brands are still not using their full potential. This study not only invites you to use TikTok to empower your brand, but it also gets deep into what you must keep in mind while doing so. If you are interested in getting an expert walkthrough of the study, write us at [email protected]  

Methodology

As previously stated, we tested 60 ads from 20 brands across markets and industries such as FMCG (Fast Moving Consumer Goods), Beauty, Insurance, Fashion, Technology, Automotive, Retail, etc. TikTok simulations, standalone ads, and surveys were tested among 7280 respondents. 


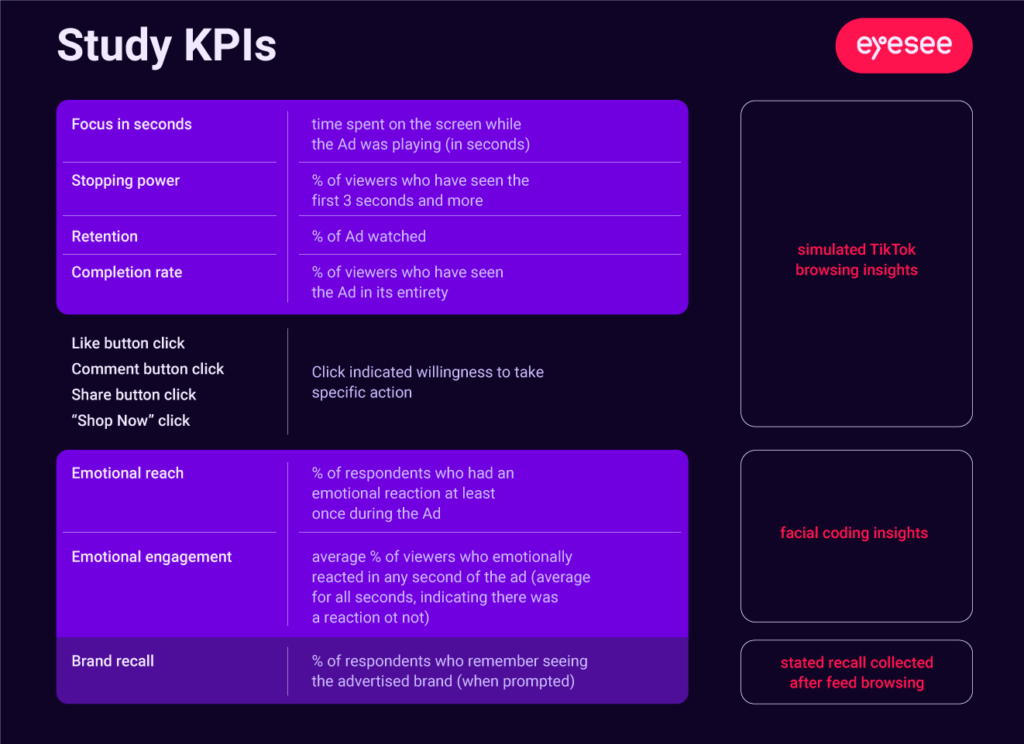
This research is built on the following key pillars:    

  • Ad stopping power (tested the ads in a simulated TikTok environment that provided us with browsing insights)    
  • Ad retention (tasted by exposing respondents to a simulated TikTok environment)    
  • Ad emotional reach (tasted by exposing respondents to standalone ads and utilizing face coding methodology)    
  • Ad likability (tasted by exposing respondents to standalone ads and utilizing face coding methodology)    
  • Brand recalling (to learn % of respondents who remember seeing the advertised brand when prompted, we used the survey method) 

The challenge of TikTok advertising

Why don’t brands use TikTok more? This is the imposing question that arises when we look at the numbers that show the untapped potential. On one hand, we have the answer that for brand managers, it is hard to follow the ROI once they invest in TikTok ads. They are unsure how to follow the path and make a clear connection, or better to say, they are unsure how to follow the path to purchase from the TikTok ad to the shopping cart. 

 On the other hand, even when clarity in that field is gained, the questions of how to approach strategy and what works best remain. There are questions about what will work better – the native approach or strongly branded videos that will also work on other platforms; what is the reach of animation as the dominant style; and is co-branding the way to more followers and engagement or the way to poor brand recollection? 

This study answers all those questions and beyond. For example, animated video ads, those containing any kind of computer-generated imagery, will improve brand opinion by 23% and increase brand interest by 19%, while elevating the positive emotions about the brand by 20%.  

However, brands must be careful; there is a chance that they will be seen as less informative than conventional videos if the message and narrative in them are not constructed carefully.  

The golden rule for unlocking the untapped potential 

What is great about this report is that it contains a lot of simple facts that must be considered in future ad planning. For example:   

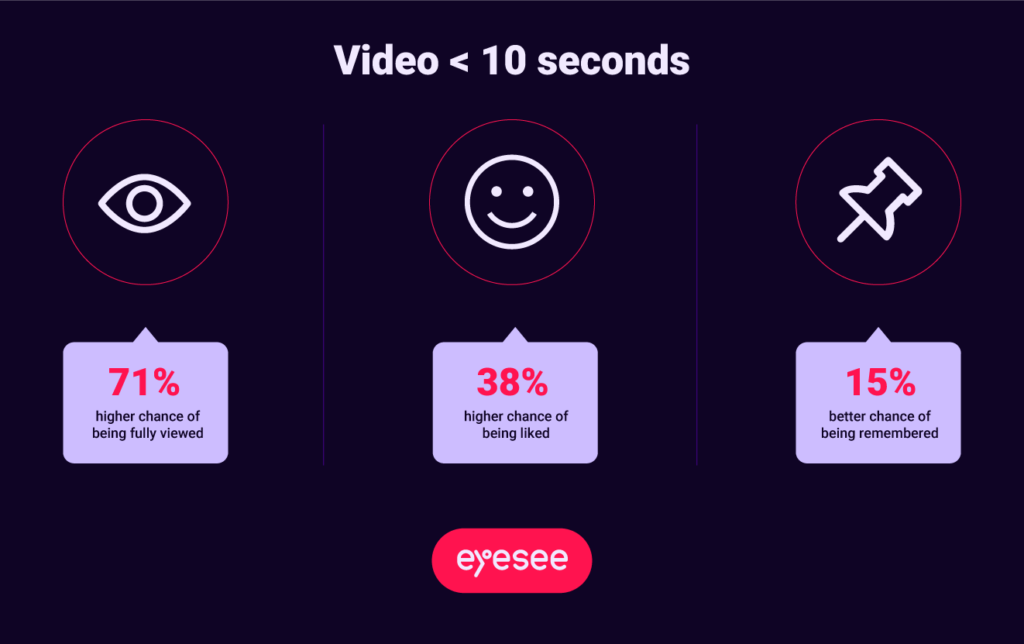
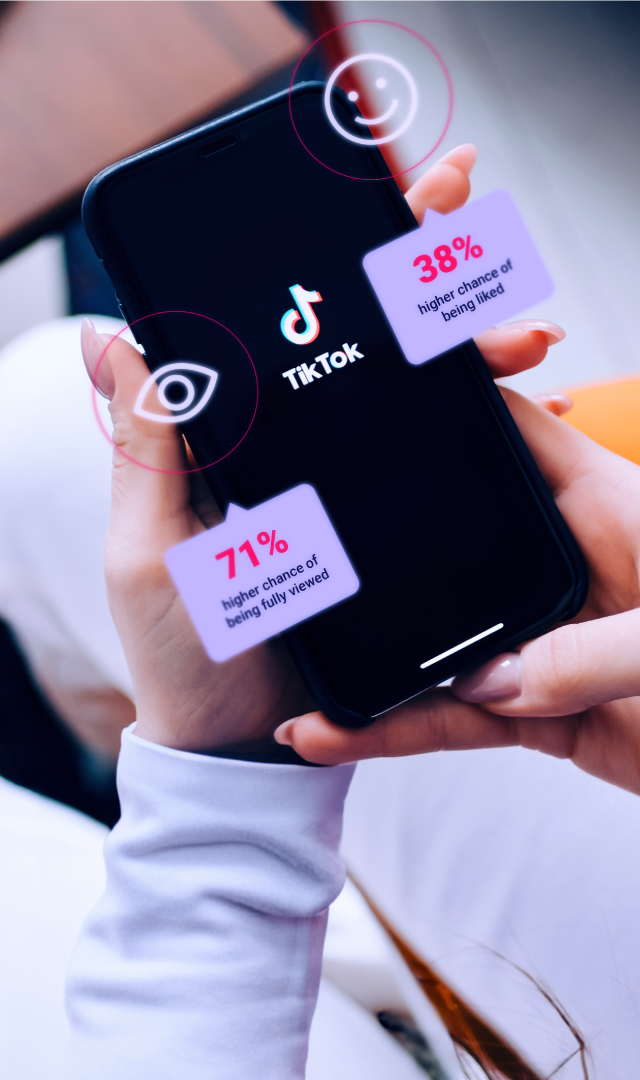
  • If the ad lasts up to 10 seconds, it has a 71% higher chance of being fully viewed.  
  • A video that lasts up to 10 seconds has a 38% higher chance of being liked.  
  • If the brand lasts up to 10 seconds, it has a 15% better chance of being remembered.  

This is an example of an insight finding that makes a strong recommendation that is universal around the world. However, in this report, there are far more complex recommendations that necessitate a thorough examination of both specific brand values and the TikTok environment. 

All of this is only the beginning. If you want to learn more, send an email to [email protected] and we will provide you with a video expert walkthrough of the study. Not only will you get the big picture and the future framework for making strategic TikTok ad planning decisions, but you will also be able to formulate specific questions for your specific pain points, which we will gladly assist you with.  

Request access to

TikTok creative study findings!


Eager for more? Read the blog about replicated feeds for authentic behavior here.

    EyeSee @ GRIT Top 50 Most Innovative MR suppliers!

    For two decades, Greenbook’s GRIT Reports have been the go-to resource for tracking trends in the insights industry, empowering brands, suppliers, and professionals to succeed. The annual Insights Practice Report focuses on essential approaches and skills, providing a comprehensive guide for growth.

    EyeSee debuted on the GRIT Top 50 most innovative research suppliers list this year, among fourteen other tech-enabled companies. Tech-driven suppliers are rapidly gaining market and mind share; the industry is on a continued search for solutions outside of the “usual suspects” and “challenger brands” that provide alternative research frameworks.

    The CEO of EyeSee, Joris De Bruyne, who has witnessed firsthand the team and client list growth over the past few years, offered the following observation:

    ‘Businesses like EyeSee, which focus on applied behavioral testing, make a big contribution to what the market research industry views as innovative. We are constantly finding new ways to combine methods, scale them via technology, and uncover true reasons behind consumer decisions. High predictive power of behavioral insights is the main driving force of our innovative initiatives and reason why more than one half of top 30% CPG brands place their trust in us when in need of research.”

    Joris went on to explain that the EyeSee team is proud to be listed in the GRIT report with so many well-known figures who consistently motivate EyeSee to do even better. Novak Marinkovic, the Head of Research and Development at EyeSee, provided the following perspective on what is to come:

    ‘The report data demonstrates that technological investment increased as the pandemic spread and has continued to be significantly higher than pre-pandemic scores. EyeSee has always given applied technology a high priority; it is in our DNA. Over the years, we’ve introduced technologies to improve the output’s speed and accuracy. Currently, our primary focus encompasses two vital topics: (1) the development of social media replicas and the Collab platform, and (2) continual development of social media replicas as testing environments in order to meet ever-evolving trends and demands of our clients.’

    The GRIT Top 50 list signals our industry’s direction: increased supplier diversity, tech-led growth, and an emphasis on real innovation. To access the full annual Insights Practice Report and Top 50 most innovative research suppliers list, request access here


      Worldwide consumer behavior: 4 different perspectives

      We learned a lot about the shift in consumer behavior after the pandemic and during inflation from a recent meta-analysis study conducted by EyeSee. However, different perspectives shed light on different challenges and opportunities. EyeSee excels in connecting and scaling global knowledge since it operates in 50+ territories, constantly accumulating insights through deep behavioral analysis in a wide range of industries.  

      Our data, insights and business experts, all of whom came from different places, told us how they see consumer behavior changing, what kind of innovation they hope for, and what their predictions for 2024 are.  

      Perspective #1: APAC aims that traditional beauty ingredients become global trend 

      Xinyu Tok, Senior Insights Manager, APAC 

      We’re a diverse market with varying external influences that shape our choices. 

      The rising costs of living and inflationary pressures are global phenomena that we’re also exposed to. 

      Yet, the recent COVID crisis has also brought the need for self-care practices to the fore—one that encompasses emotional, mental, and physiological care. 

      As a self-care advocate and a researcher working a lot in the beauty industry, what makes me excited is to see how brands can connect these phenomena to offer us affordable luxuries in the beauty and personal care space. 

      Particular to Asia is also our usage of traditional skincare ingredients that vary across the different cultures here. This offers a rich playing field for brands to provide beauty seekers here with a modern take on natural, wellness-inspired beauty products. For instance, Bakuchiol (used in traditional ayurvedic treatments) arose as an alternative to the popular retinol. 

      In 2024 and the years to come, I would love to see how ingredients used in traditional Asian skincare treatments would be recognized and amass greater mainstream popularity. 

      Perspective #2: LATAM is all about brand-alliances and cross-selling 

      Victor Olivares, Internal Business Development Consultant at EyeSee, LATAM 

      I think brand loyalty is being tested since incomes at home are not enough due to the crisis; people might be switching to cheaper brands or avoiding certain expenses while at the same time spending money on entertainment because of COVID-19 post-lockdown. In markets where the economy is more unstable, things are getting much harder. 

      There are new flavors in the FMCG category (biscuits, chips, sodas), including brand alliances and the usage of brand licenses for cross-selling, but as a movie fan, the ones I have my eyes on are the new popcorn flavors in cinemas. 

      It’s hard to pick one future trend because there are a lot of trends lately: eco-friendly products, light/zero sugar versions of some things, but I think consumer experience will become more relevant, so I think we will see a lot of “memory makers” (people making up for the “lost” time and trying to document every moment) reconnecting with things, trying to be heard and seen. 

      Perspective #3: Sustainability is still strong trend in EUROPE 

      Nicole Tudosie, Business Development Director at EyeSee, EUROPE 

      Given this is a global crisis, we in Europe are also strongly affected by the effects of soaring inflation, and with mortgage payments starting to go up for many, shoppers’ disposable income is being squeezed. 

      In the UK specifically, food has seen some of the highest levels of inflation and considering 86% of people are looking to improve their health, it’s a struggle to do so when these items are usually more expensive. 

      I think the biggest area of innovation will continue to be sustainability, and I’ve seen some great recent examples, like Penny in Germany launching a ‘true cost’ campaign to raise awareness of the environmental price of producing food; or rolling out our digital screens and labels to reduce waste in stores. 

      Sustainability, as we saw with Penny, will continue to be important for consumers, and therefore innovation is needed here. 

      I’m very excited to see what role AI will play in CPG next year! I recently saw that Migros launched the world’s first AI-created drink, where ChatGPT generated the recipe based on recent trends, and the packaging was created by another AI tool called Midjourney. Where next? 

      Perspective #4: USA consumer confidence and optimism is coming back 

      Jason Bradbury, Sr. Director Client Service 

      Despite a difficult economic climate right now in the US which continues to be shrouded in uncertainty, consumer confidence and optimism is slowly improving relative to where it was just a year ago.  Consumer spending remains strong, however, they are more cautious about how and where they spend their money.   A spending paradox has emerged…  On one hand, consumers are making more choiceful purchase decisions – in some cases seeking greater value by trading down to less expensive store-brand items to maximize their spending power.   Despite this, there is a clear openness to splurge – to treat oneself by paying premium prices for higher-quality products or those that are driven by spontaneous cravings.   

      I am excited to see the unique products that emerge following the sale and acquisition of several CPG firms that took place in 2023 and the strong desire by key companies to create news within their respective categories (blending brands, blending product benefits, and core product equities into new products). Companies are constantly looking to expand their offerings to attract new customers, and I think the competition in the industry right now may help to inspire new innovative creativity that will drive unique products to market.    

      I think, we are going to see a major boom in social commerce spending – particularly on TikTok.  Social media has emerged as a powerful platform for driving product discovery and promoting ecommerce. In 2023 we saw brands registering success with TikTok ad campaigns and I suspect that in 2024 we will see a major surge as many others follow suit.  With so many younger consumers using TikTok to discover, research, and offer their impressions on products, I foresee that TikTok will naturally become a more relevant part of their shopping process. 

      Every territory and every market has its own rules, but maybe it is exactly in the differences between the untapped opportunities lie. It is not uncommon for local trends to become global and vice versa, so keeping your eyes on all four sides of the world is strongly recommended. 


      Interested in diving deeper into consumer behavior knowledge, tune in and follow our podcast you can acquire here.

        Post-pandemic consumer: restraints strengthen cravings    

        by Mirna Djuric, Product Capability Director at EyeSee

        The world has gone through quite a few disruptions over the last three years. According to CPS GfK over 60% of European households are in or close to a serious budget squeeze, with Western European countries, especially on the rise. Nearly 2 in 3 consumers declare to cut their out-of-home (OOH) spending, including visiting restaurants and bars, buying clothes (-48%), as well as gifts, decorations, and takeout/delivery (all at -46%).   

        But even though shoppers are more focused on preparing meals at home, the EyeSee meta-analysis shows that the food part of FMCG has suffered the most. This meta-analysis is based on 250 studies in the FMCG category. Samples ranged from 50.000 to 150.000 respondents per method, spread over 4 geographies – US, Europe, APAC, and Latin America. They included methodologies such as Eye Tracking, Facial Coding, Virtual Shopping, and surveys, and they were all done in highly realistic shelf environments that, 95% of the time, matches actual shopping behavior.   

        After gathering all the data, it was grouped into pre-pandemic (2018 and 2019) and post-pandemic and all subsequent events (2020-2022), and eventually compared.  

        Food category products are more likable but less bought  

        It does not appear obvious that in times when shoppers are spending more time preparing meals, food would be the most crisis-influenced category in the FMCG category. However, if we remember that one of the key takeaways from the EyeSee pricing study was that the main goal of shoppers is to spend as little as possible, even if it means buying smaller packs of products and getting less value for their money, we may be able to gain a better understanding of this type of behavior. Food products are the ones we buy every day, and we can see their price increases getting higher and higher, whereas, in other non-food categories, we do not buy as frequently, so we do not have a sense of their impact on our overall budget.  

        However, when shoppers are directly asked about the products, they will react positively and describe them as highly desirable, keeping in mind that we all want to resume our pre-pandemic lives as soon as possible. But what they will buy is a different story.  

        In the food segment of FMCG, both consideration and penetration rates have decreased by more than double. Simply put, fewer people are buying fewer products, and competition on the shelf is fiercer.   

        Shoppers’ exploratory behavior has also decreased, and individual SKUs and brands appear less visible on the shelf. Shoppers appear to spend more time finding exactly the product they intend to buy and less time exploring other options.  

        Visibility in the first 5 seconds dropped significantly, as did attention to the key zone, meaning shoppers’ exploratory behavior decreased and they are possibly spending time on shelves analyzing price tags instead of browsing products.  

        However, the likability of products significantly increased, meaning they were found to be more and more attractive and relevant.  

        Is e-commerce a saving grace for FMCG in the US? 

        With increased e-commerce spending, we can expect that FMCG in the US will potentially remain healthy. It is also interesting for this market that on the pack navigation, the US stands out by brand importance.  

        This is the only region where brand logos are gathering more consumer views. Like other markets, secondary images lost visibility while claims gained it. This suggests shoppers want to be more certain they are getting the product they intended to buy beforehand, meaning shopping is more targeted.  

        Very similar patterns are evident in the European markets as well; although actual shopping hasn’t yet universally decreased, there are indications that shoppers are more cautious (relying on tried-and-true brands) and therefore less exploratory.   

        The nonfood category remains stable but claims gain importance  

        Even though non-food products are still in the same or similar demand, and even though post-pandemic cravings among shoppers are strong, when spending money in times of crisis, they may feel the need to justify their spending, so they will turn to claims and question them, having more information now than during carefree pre-pandemic times.  

        This higher level of caution is confirmed when looking into navigation patterns in the non-food category. Claims have gained significantly more consumer looks resulting in a 50% increase in claim visibility. Other pack elements, particularly imagery, both primary and secondary, suffered in consumer attention.  

        Our packaging and claim expert, Tijana Lukic, provides more context in terms of what post-pandemic consumers look for in the non-food category.  

        “End-user benefits are most important, and the more specific and concrete they are, the better.“ She also notices that shoppers have become true experts, they are knowledgeable about ingredients, their benefits, and their risks, so they choose cautiously.   

        “Shoppers are open to innovation in this category still, but they need to be educated by the pack design about what the innovation brings for them. So, the concrete benefits are appreciated. Sustainability of the product is important, but it hasn’t exited the nice-to-have category yet in most non-food categories.”  

        Latin American market can expect further decreases in FMCG   

        In the Latin American market, on the other hand, shelf purchases significantly decreased, but not only that; consumers are consciously saving. Even stated purchase intent, which usually lags the actual purchase, shows a decrease in this market. This suggests we can expect further decreases in FMCG in LATAM.    

        Conclusion  

        With all of these insights in mind, it is evident that different markets show different results depending on their strengths and weaknesses. However, the pressure of one crisis after another can be more or less felt everywhere. Even though the average consumer wishes to go back to his previously carefree life and spending, their budgets simply do not allow it.   

        From the producer’s perspective, category leaders are under more pressure than ever to sustain their market growth. If you are interested in this topic and want to learn more, register for GreenBook X EyeSee webinar on How Category Leaders Adapt to Post-Pandemic Consumer Behavior here – https://bit.ly/3Kwcs7D 


        Interested in findings from our pricing studies from the US and which categories have we researched? Read all about it here or you can check out the full webinar featuring Heather Graham (Director Client Service @ EyeSee), Sasa Radojevic (Sr Shopper Insight Manager @ EyeSee), and experienced retailer & Awarded 2022 Top Women in Grocery (TWiG) Raina Rusnak.

          Women who shape research and us, part 2: Buying context

          With Women’s history month coming to an end, let’s dive into the second installment of the Women that shape research (and us) series. This time around, our top experts and impressive women selected breakthroughs about buying behavior that define the current moment.

          Instagram done right

          Testing in replicated environments is becoming the new standard for breaking down authentic consumer behavior; especially the complex and often elusive link between scrolling and buying. A validation study that was just completed set out to compare how consumers act in recreated Instagram feeds and reels for testing versus the actual Instagram app – here’s what we found.

           Here’s an overview of other top findings:

          • Positioning matters: Ads that show up in the first 12 posts on the feed have up to 50% more visibility.
          • Visibility is not the same as memorability: Lower brand recall (29%) occurs even with the visibility is as high as 70%
          • Long ads are not Insta-friendly: You can lose ~85% of your audience in less than 5s

          Social buying pushes the market research to do better

          The social apps in China evolved to encompass all aspects of the consumer journey, including services such as delivery & in-app supermarket services, and retail search engines; they are an integral part of not only every facet of shopping, but everyday life.

          Given the proliferation of e/social commerce, clients are looking to test how their concepts fare in the context of very particular platforms. For example, assessing the specificity of TikTok formats  and developing platform-specific best practice gives you a clear competitive edge.

          How much freedom is too much?

          The crisis of recent years really brought home how resilient, flexible, tough, and above all adaptive we all are – just look at the evolution of online services.

          Research by Global Web Index reveals that 1 in 5 internet users across 20 markets will be looking for more flexible payment options in the coming months – everything from free cancelations to refundable options improves shopping experience and potentially increases turnover. The key challenge for brands now is to strike the right balance with flexibility, and not overwhelm consumers with choice in order to discourage final cart dropout.


          Make sure to check out the first installment of the series where top talent from Mexico shared their insights!

            Know when to play the AI card in eye tracking

            By Milica Kovac, New Business Development Manager at EyeSee, Researcher and former Senior Product Manager

            Facing high inflation, most decision makers in market research are trying to find alternatives for quick savings. For example, AI-based visual prediction models promise to eliminate the need for eye-trackers as they give faster and more affordable results; and supposedly – just as good.

            Let’s examine if this is really the case.

            BTS of human gaze analyses  

            While both AI predictive algorithms and eye trackers seek to provide human gaze estimations and help us understand attention and visibility KPIs, they operate fundamentally differently.

            Regular eye trackers rely on the data obtained from mapping the respondents’ eye gaze, while saliency-based AI solutions predict behavior based on the audio-visual features of the stimuli gazed at, relying on insights from cognitive science – what we know about how humans usually perceive things. In essence, this means that regular eye trackers deliver an answer to what is seen, while AI models suggest what is probable to be seen.

            Consequently, eye trackers can chart the variance in behavior of different target groups inspecting stimuli, while prediction algorithms showcase the probability of what is seen by an average human. This means that if your study is looking at an average population, or you are looking for a simple reality check of early development concepts – AI might be good enough for the job. For all other cases, validation or full application of eye trackers is still advised.

            Scientific and practical gaps

            When talking to an AI vendor, it’s important to ask about the timeframe for which their model predicts visibility. Does it predict what’s most likely to be seen on a product packaging or a webpage at first glance, or does it predict visibility after the user has browsed for some time? You may be surprised by the variety of answers aka absence of any standard in the AI field, as well as by the inconsistency of some models with what we know from cognitive psychology about human memory.

            Some AI solutions predict intuitive attention and visibility in the first 150 – 250ms. According to the Atkinson-Shiffrin memory model, when we see something, the entire information registered by our eyes is first stored in our sensory memory. This is a very short-term storage that only lasts for about 250 milliseconds, during which time the information is not yet processed in any way. Only when the information passes into the working memory, under the effect of selective attention, is the limited information about the stimuli being processed but for no longer than 15 seconds (with the average human attention span tending to decrease towards 8 seconds). Eye-tracking devices usually capture attention ranging from 3 to 7 seconds, coinciding with the duration of information processing. Going beyond theory, even from a practical perspective, is it really useful to know what can be observed on a website within a duration of 150-250 milliseconds?

            Saliency is (still) mostly context-unaware

            To fully understand the power and limits of the AI approach, my team recently completed a validation study of saliency-based algorithm for predictive eye tracking. We selected a number of stimuli typically tested in consumer research studies across industries and channels: from vertical and horizontal packaging stimuli to shelf images and webpages. We compared the results obtained by two different AI models available and popular on the research market with the results obtained using eye-trackers on human respondents.   

            What we’ve found is that saliency models are consistently under-predicting semantically important image regions; in some cases, they failed to catch the importance of a brand name on a pack aka failed to determine that those are not just any letters written in certain color, font and size.

            What’s more, different models tend to favor different properties such as text, colors, faces, and others. Knowing that helps identify a model’s deficiency and choose an appropriate model for a specific application. For example, some models are better at capturing text area, while in some others, the sound is not considered. Further, different algorithms might not be trained on a certain type of stimuli, which could undermine findings for an entire category.

            While this might get better with time, the overall conclusion is that more complex (full shelves, e-commerce websites) and dynamic (video ads) stimuli prove to be way too challenging for AI predictive algorithms as they are still incapable of contextual interpretation. They inspect the size and contrast, not the content; and in doing so, they often fail to capture the meaning. Knowing just how much meaning we attach to brands, letting AI conclude that it is looking at a purple cow feels stripped of all the meaning we attach to a brand like Milka.

            An excerpt from a recent study published by the Institute of Electrical and Electronics Engineers provides an additional point of comparison between prediction algorithms and real eye-tracking.

            Three different algorithms were used to predict what humans would look at while watching soccer players in colorful jerseys practicing with a football. The first algorithm picked up the colored regions as the most significant points, while the other two algorithms were concentrating on the players’ faces. Both underlying assumptions are justified from a cognitive science point of view: colors (especially red), and faces do grab people’s attention. However, true eye-tracking data showed that people were looking at the ball during soccer match, because they understand the meaning behind this game.

            Conclusion

            So, what’s the verdict on AI in this case? We’ve previously established that not all AI predictive models are created equal; they process and favor different properties. Keep this in mind, when selecting for a solution – you might find yourself short of one single perfect algorithm; in reality, you’ll have to choose every time you conduct a study.

            However, this does not erase the fact that predictive algorithms are more scalable than full eye trackers. It is possible to imagine a scenario where a single application gathers data about both the user and the stimuli. By leveraging the complementary nature of subjective human eye-tracking and objective graph-based visual saliency modelling data, such solution would ultimately lead to a more reliable and efficient output. Until then – real eye tracking is still supreme when faced with complex questions that require nuanced insights.


            Interested in application of behavioral methods? Check out our previous blog on measuring attention!

              Women who shape research and us, part 1: The talent of Mexico

              At EyeSee, women add up to 71% of all insights and data researchers; roughly 8 out of 12 Directors are in fact women who define every facet of our agency. It is not an exaggeration to say that having this perspective uniquely influences how we tackle clients’ needs, deliver results and lead in consumer behavior insights. Therefore, we take Women’s month (as well as any opportunity) to reflect, acknowledge and celebrate women who shaped research and us.

              First off, we checked in with our team based in Mexico City regarding their thoughts on consumer insights and the state of market research industry.

              Are we doing femvertising right?

              When asked what sort of patterns distinguish advertising of today, Daniela Blanco, Senior Insights manager at EyeSee had this to say:

              Daniela observed that women aged 25 to 50 in Mexico do not feel represented in advertising, and they consider that brands do not represent gender equality. With femvertising, brands can better connect with female consumers, but above all, empowering, encouraging and strengthening women; which also benefits men and society in general.

              In the same way, it was shown that there is a positive influence on the perception of Corporate Social Responsibility (CSR) of brands that use messages of empowerment of women, several studies have shown that this type of advertising improves the self-esteem of girls and adolescents, even in patriarchal and collectivist cultures.

              What is the key challenge with consumers of today?

              The consumer insight that is key to understand the behavior of the new generations is Average Attention Time, argues Yael Moctezuma, EyeSee’s Junior Data Analyst. She explained:

              Environments such as social media pose additional challenges when it comes to creating a successful video ad. Ferociously fast-moving timelines have brought on the need for marketers to become excellent managers of attention. Consequently, attention metrics come into play as the strongest indicator of success: being three times more predictive than viewability, attention metrics inform marketers about how much of the video content will actually be seen.

              Is the future female?

              As you might have discerned by now, Mexican team is comprised of outstanding female influences that inspire us daily. One of which is Alexandra Mar, EyeSee’s Insights manager whose previous experiences cover health, finance, and EdTech sectors. She took this opportunity to reflected on employment gaps and imbalances, and outline reasons to curb optimism:

              The impact is felt across industries including market research, claims Alexandra. If the future were indeed to include a more balanced female presence in the industry, the first step is to ensure empowerment through knowledge and training.

              Incidentally, our Mexico Country Lead & Insights Director Diego Adolfo Chávez Terrazas just joined the impressive list of Women in research mentors, organization that works tirelessly to advance position and amplify voices of women in the industry. He echoed Alexandra’s concerns and added a very personal take:


              Interested in this topic? Check out our #FollowInsight article inspired by Women’s month.

                No one-size-fits-all: The many levels to getting the sample size just right

                Let’s try something: google ‘sample size’ – what did you get? One of the first search suggestions that come up is definitely a ‘sample size calculator’. But let’s be honest, how applicable is it for real-life research needs?

                To oversimplify, generally, the bigger the sample size, the better – more respondents, more answers, more predictive insights. But is that move always business savvy?

                Let’s take a look at some cases where being smarter and creative adds value when picking the right sample size:

                On your mark, get set, go psychometric

                Ask any researcher, and they will tell you that the guiding light to picking the right sample size is choosing the margin of error (be it 99%, 95%, or 90% – in commercial research, 90% is typical, while in academics, 95% and 99% are the usual go-to’s). Typically, a larger sample size means a smaller error if all other variables are stable.

                Following the basic psychometric principles, you would opt to have (at least) 5 times more respondents than the number of items. While traditionally, the item is a survey question, it can also be the number of SKUs on a virtual shelf. For instance, if you have 100 SKUs – the rule of thumb is to have 500 respondents.

                But for shelf studies, even 300 may be enough when researching the impact on brand and category, which is most often the case. With more respondents, valid and robust insights could be made on an even more granular level of analysis.

                Not every glove will fit the different methods

                Of course, apart from the margin of error, the sample size also depends on the methodology used. While some surveys can include a minimum of 50-75 respondents, Virtual Shopping exercises with a standard-sized shelf need as many as 300 to collect accurate results. To further prove this, a standard (before cleaning the sample) for Facial Coding is 80, while Eye Tracking requires 60 and still yields highly predictive insights.

                Why the vastly different numbers? Well, both Facial Coding and Eye Tracking provide results that are universal for humans and highly biologically determined. This means that we can use smaller samples to determine the way that people perceive specific stimuli. In other words, adding more respondents to the study will not significantly change the results, nor will it enhance the results.*

                Moreover, methods such as RTM, MaxDiff, Conjoint, Findability, etc., require a certain number of people to fully complete the exercise as a minimum to get the insights we need, which can change the starting sample size. 

                It is also essential to keep in mind the analyses that need to be done so that the final output is robust enough at the most granular level of analysis required for the initiative. For example, as our Shopper Insights Director Dobrinka Vicentijevic explained – if you are doing segmentation and want to get 4 segments of consumers with different characteristics, you would start from the group you expect to be least represented and build the sample size from there. If the smallest group you expect to analyze is represented by around 10%, then you will need 1000 people to get 100 of them – and the same logic can be applied to other methods, starting from their minimum sample for the subgroup.

                However, Milica Kovac, EyeSee’s Senior Product Manager, underlines the importance of not having too many quotas and cross-quotas in online studies – it requires real-time monitoring of each and every respondent that comes into the database and knowing exactly which quotas will close when. An alternative for some studies conducted online would be a carefully planned combination of softer quotas and statistical procedures that follow. But what should you do if you need to conduct a specific analysis (e.g., brand split) but don’t have enough users?

                What Heather Graham, Client Service Director at EyeSee, believes is a solution for this is knowing the brand user volume market share. When it comes to testing pack redesigns, for example, this allows us to estimate the natural fallout of users from a category-representative sample and determine just how many are needed to boost the sample. This further ensures an analyzable base size of users for pack redesigns.

                Yeah, statistics are cool, but do you know your consumer?

                But then there are times when the sample size is not dictated just by the analysis – but by the end-user of the study results. For example, in category management studies (planogram and decision tree studies), the main KPI is sales potential.

                So, when the client knows that 1% of real sales growth brings millions in revenue to the company, showing that 15% in sales growth is statistically irrelevant due to a small sample size is simply not the way to go. That’s why the sample is increased for the sake of usability and reliability of the obtained data for such studies.

                However, if the incidence rate of a particular consumer group is extremely low – instead of increasing the sample drastically to naturally capture enough consumers from that group, an adequate sample is taken for all other required target groups instead. Then the number of people with extremely low IR is boosted as a separate sample.

                Be savvy when choosing the right research design

                A monadic research design entails a study in which the respondent evaluates only one product, concept or ad – rather than comparing it to different test stimuli. In doing so, you can ensure that the data you get is not influenced by any other stimuli.

                But there is a good reason why sequential (monadic) designs also exist, and the insights they unlock can be priceless when compared to the standard monadic approach – especially when testing the sales potential of new products. Not only does it require a smaller sample, but by having the same people make two shopping trips, one in a competitive environment before the new product introduction and then another one with the new product launched and implemented on the shelves or webpages, it captures the all-important switching behavior and potential cannibalization effects.

                Why are we talking about the design so much? Well, sample sizes are a part of the research design and having a comprehensive understanding of the design characteristics opens up room for sample size optimization!

                Key takeaways:

                • Don’t throw psychometric principles out the window – but leave space for optimization and sample tinkering to boost the reliability of research findings
                • Different methods have their own rulebook –their requirements can be vastly different, so it is vital to have an in-depth understanding of each one
                • Know who your audience is – both in terms of who will use the data and the target audience you recruit
                • Be picky about research design – it is not impossible to answer more questions with a seemingly smaller sample size

                *For a more detailed breakdown of choosing a sample size for these methods, check out this Proof of Method

                  All set to learn and connect? Let’s meet up at upcoming events

                  What does 2023 have in store – for consumers, brands and marketers? Let’s talk about it! From Bangkok to Los Angeles and Amsterdam, come and connect with EyeSee’s very best at upcoming industry events all around the globe! After the very product chats we had at IIEX APAC, Quirk’s LA, and Annual Category Management and Shopper Insights Conference, here’s where you can find us in the next few months:

                  Quirk’s Chicago | March 27-28

                  Coming to Quirk’s Chicago? Drop by our booth #708 for a chat with Laura Hoste, Cliff KaneHeather Graham – and find them on the conference stage (more info about the speaking session featuring te latest findings of the Pricing study in inflation coming soon!)

                  IIEX EU | March 28-29

                  And lastly, Nicole Tudosie, Alexandre de Jubécourt and Morana Kristek will be holding the fort at the IIEX EU booth #6 in Amsterdam. Don’t miss our Shopper Insights Director Dobrinka Vicentijevic comparing various virtual store options and learnings – see more here!

                  Other events coming up:

                  MRMW APAC | Apr 18-19
                  Quirk’s London | May 3-4
                  IIEX NA | May 24-25
                  MRMW NA | Jun 28-29

                    Agile tech team is a secret MR weapon

                    From the get-go, EyeSee’s mantra was to make consumer insights accessible by jumping outside of the traditional research bounds and going completely online. Starting with a webcam-based eye tracking tool, all the way to today’s custom virtual testing environments enabling the most predictive insights – our team of experts developed a whole different tech-enabled mindset that continues to guide our approach to research a decade later.

                    So, we sat down with Aleksandar Velikić, our Head of Growth, to understand how you keep the spark for innovation alive, what goes into empowering your team to grow further and unconventional ways to support organizational transformation:

                    What makes market research tech-enabled?

                    In a broader sense, a tech-enabled company is any company whose key output is technology, which bases its competitiveness on the use and innovation of tech and gathers experts.

                    From the very beginning, we have been utilizing tech to improve, speed up and make consumer research accessible at EyeSee. Exactly ten years ago, we developed an application within which we can map and monitor eye movements of study respondents via their computer webcams. This was a huge step forward in the industry – until then, it was necessary for respondents to personally come to a central testing location in order to be a part of a research project.

                    Studies for commercial clients became faster, and the quality of the results was improved due to the larger number of respondents being included by conducting research this way. For example, you can get an eye-tracking test and a report in about two weeks, while previously, such research would have taken up to several months.

                    After eye tracking, we developed other methods, such as facial coding and virtual shopping – and clients recognized this. Today we cooperate with global brands, such as Microsoft, Google, L’Oréal, Heinz Kraft, Danone, TikTok and others – all from several hubs in London, Paris, New York, Singapore, Mexico City, Ghent and Belgrade.

                    Our interdisciplinary R&D team is the second largest team at EyeSee, and as it turns out, even our more traditional competitors are slowly establishing the so-called automation or innovation teams as well!

                    How to reel in top-notch tech experts?

                    You draw in a tech-savvy workforce, like any other, with a human approach to work – provide proper working conditions and opportunities to be a part of exciting projects in which they see purpose and a chance to do something that will make a difference. Right now, paralyzing and demotivating myths about developers, such as exorbitant salary expectations, and the pressure on recruiters to “sell” the team or company to candidates, are circulating within the industry. These have proven to be quite harmful since it prevents us from considering the necessary conditions for tech experts and the new benefits we can offer them.

                    Three years ago, our technology team had only 3 developers, while today, there are about 30 members who work on the frontend and backend, we have a machine learning team, DevOps, a team of QA testers, several project leads and other experts trained to function according to agile, iterative principles. And in the future of EyeSee, this team will only continue to grow!

                    Therefore, you appeal by building a healthy company that reflects its attitude toward employees and has a non-toxic work culture. And if, along the way, you are offered to work on something thrilling, like eye tracking and facial coding, knowing that the fruits of your labor will interact with the world’s biggest brands in the US, EU and APAC – I must say that it’s not too bad of a deal!

                    How to retain them and stay competitive?

                    The post-pandemic time has pushed many to think in the direction of life changes. Our motto has always been: “Anyone who wants to explore other options should do it”. We trust our colleagues that they can decide for themselves what is best for them at that moment, and it is up to us to constantly optimize the environment in which they work while members of our team. EyeSee, under the pressure of client demands and growth, is continuously being transformed organizationally. And so, many are motivated to change, grow and continue to stay in such a dynamic environment.

                    During organizational transformations, horizontal moves are also one of the ways in which employees get a chance to try something completely different. For example, throughout EyeSee’s history, our colleagues have moved from creative teams to tech teams and vice versa, providing novelty and a different set of long-term business goals.

                    One of the tools we have been using since this year are retention interviews, during which we want to identify what it means the most to employees and why they are part of the team. To our surprise, many responses relate to conditions that have nothing to do with money – such as stress reduction, relief, human connections and support. Basically, our strategy is not to retain anyone but to move forward together – for some, this means staying at EyeSee, and for others moving to another environment. Both choices are correct.

                    Also, the average employee at EyeSee (27-33 years old) has “aged” in the past 10 years, so priorities change even at different ages. Juniors and younger people, perhaps, tend to lean more towards material means in the beginning, and later, when families are created, some non-monetary benefits, support, health and vacation days become significantly more important factors.

                    Want to read more about the practices that shaped EyeSee? Check out the 10 turning points that defined our approach to consumer research!

                      Thanks for your interest!

                      We”ll get back to you promptly