Upgrading retail research with behavioral decision trees

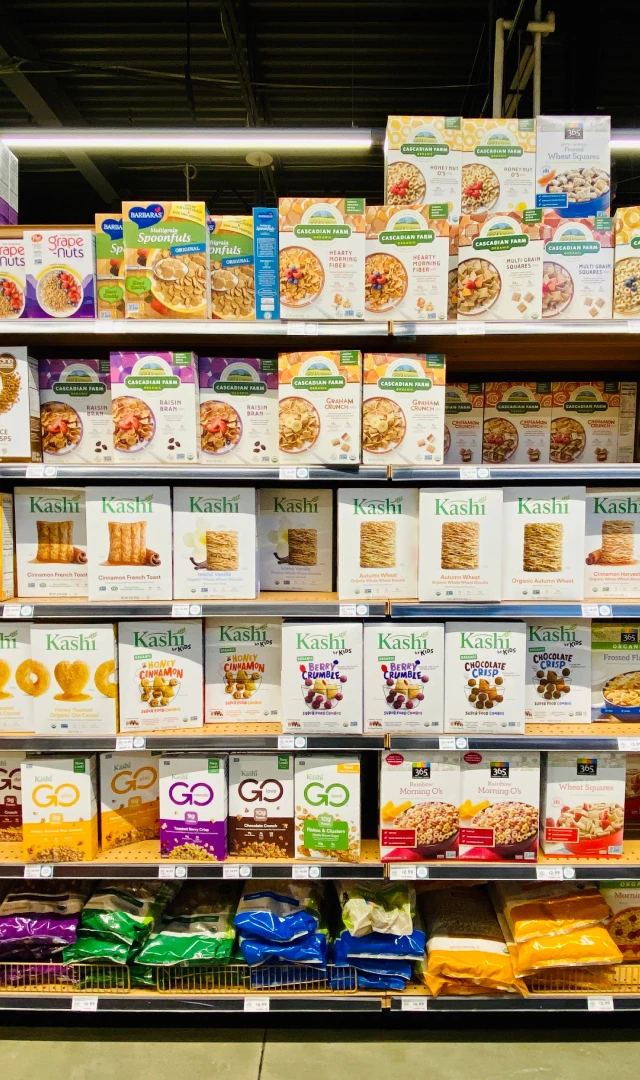
On a supermarket shelf, the interests of retailers, manufacturers, and consumers converge in the most tangible way – a consumer settles on one out of hundreds of different products at hand, and a decision is made before you know it. But how do you ensure you really understand what happens in front of the shelf? Data about end sales does too little, too late to explain the decision. On the other hand, surveys that promise prediction by relying on stated purchase intent and claims of future behavior are about as reliable as rolling the dice. Enter Behavioral Decision trees.

Decisions abound in a retail environment, leaving numerous questions unanswered by traditional research methods. What happens when your consumers have to make a trade-off in shopping? Do they stick with your brand if their go-to product is out of stock or do they switch to a substitute product easily? Which attributes are exchangeable, and where does their loyalty lie? Most importantly, how do you learn about all this?

The answers to these and many other questions are found in a Behavioral decision tree. With a new behavioral framework, this revamped tool delivers plenty of data about actual decision-making. Virtual shopping ensures respondents are making decisions in context and with thousands of real shoppers, you are delivered reliable and stable data to base business decisions on.

Behavioral decision trees – remote, scalable and highly predictive

Decision Trees are used as a graphical representation that helps manufacturers and retailers understand how consumers make decisions in front of a shelf. They provide defined product hierarchies and help category segmentation, simplify the shopper experience and maximize the entire category sales. But here’s the kicker – what differentiates the behavioral is the addition of virtual shopping environments.

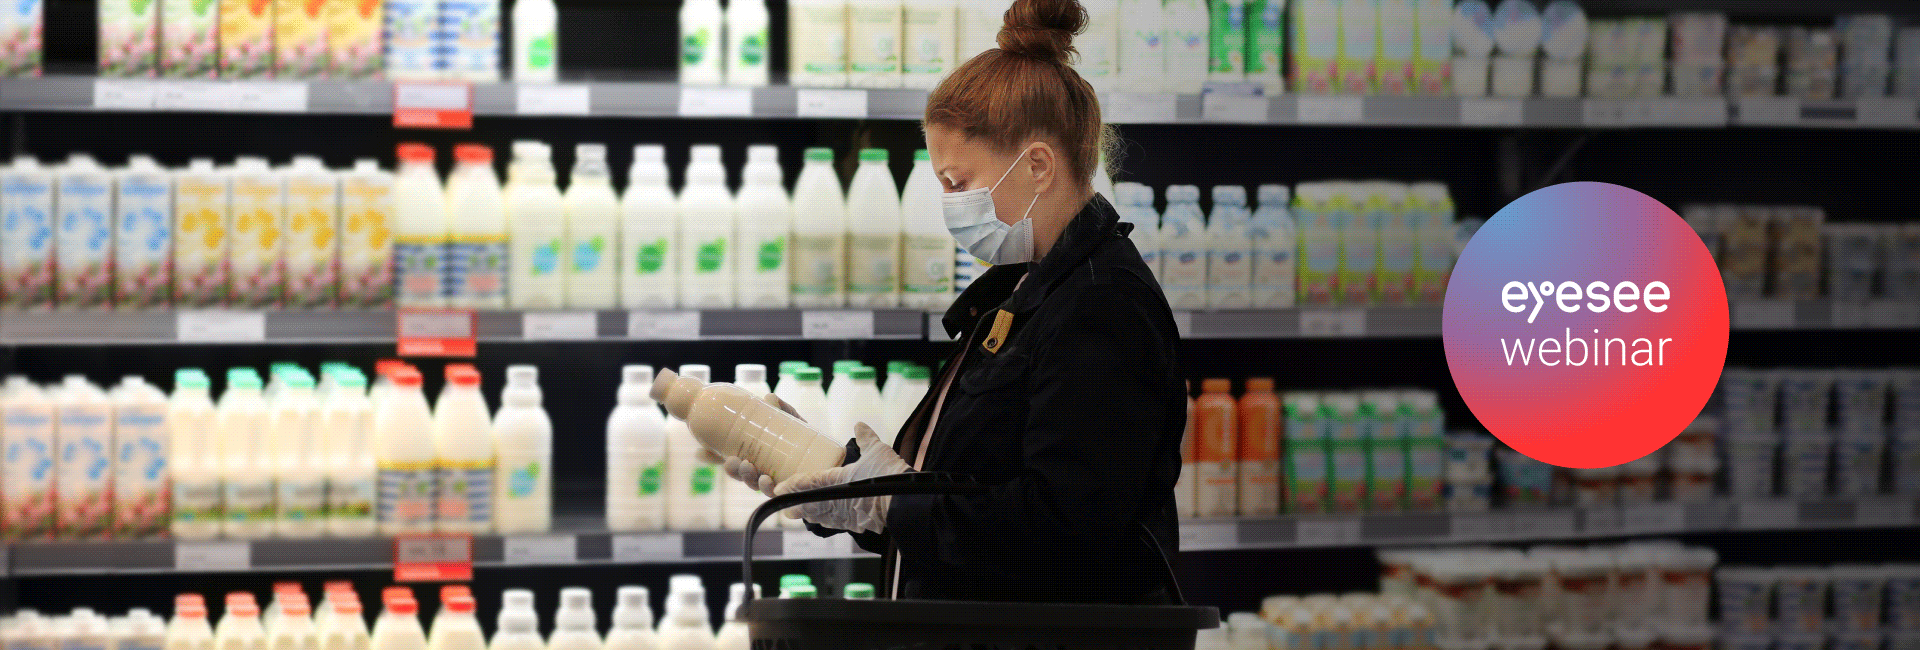
There are two key benefits of going behavioral and online – putting shoppers in context via virtual shopping environments, instead of relying on surveys, ensures real insights into actual in-store behavior. And secondly, a thing which is extremely relevant during the pandemic, but also beyond – not having to use face-to-face interviews but running the study with thousands of shoppers online, making decision trees scalable. This way, your business decisions are based on actual shopper decisions, and not on what people say they will do.

Why is virtual shopping the MVP of research?

Basing your product decisions on stated measures turns out to be a risky business. We ran a meta-analysis on over 35000 respondents from dozens of projects across FMCG industries, and compared survey results to virtual shopping data. Considering its high correlation with Retail Audit Sell-out Data (0.8) and the fact that it puts consumers in the right context, we used Virtual shopping as an external measure of the reliability of claimed future behavior. In a nutshell, the results argue that it is extremely important to be careful if you are making business decisions based only on stated purchase intent – whether top box or top2box, as both have some sort of error in them.

So, how unreliable are surveys? 

Well, we calculated the error margins and the findings indicate that the purchase intent measure is incredibly unreliable – on the brand level, the error was as high as 71% for T2B. On the SKU level, the overestimates are even more extreme at  486% for T2B and 217% for TB.

Mapping out the pain points and opportunities in a category

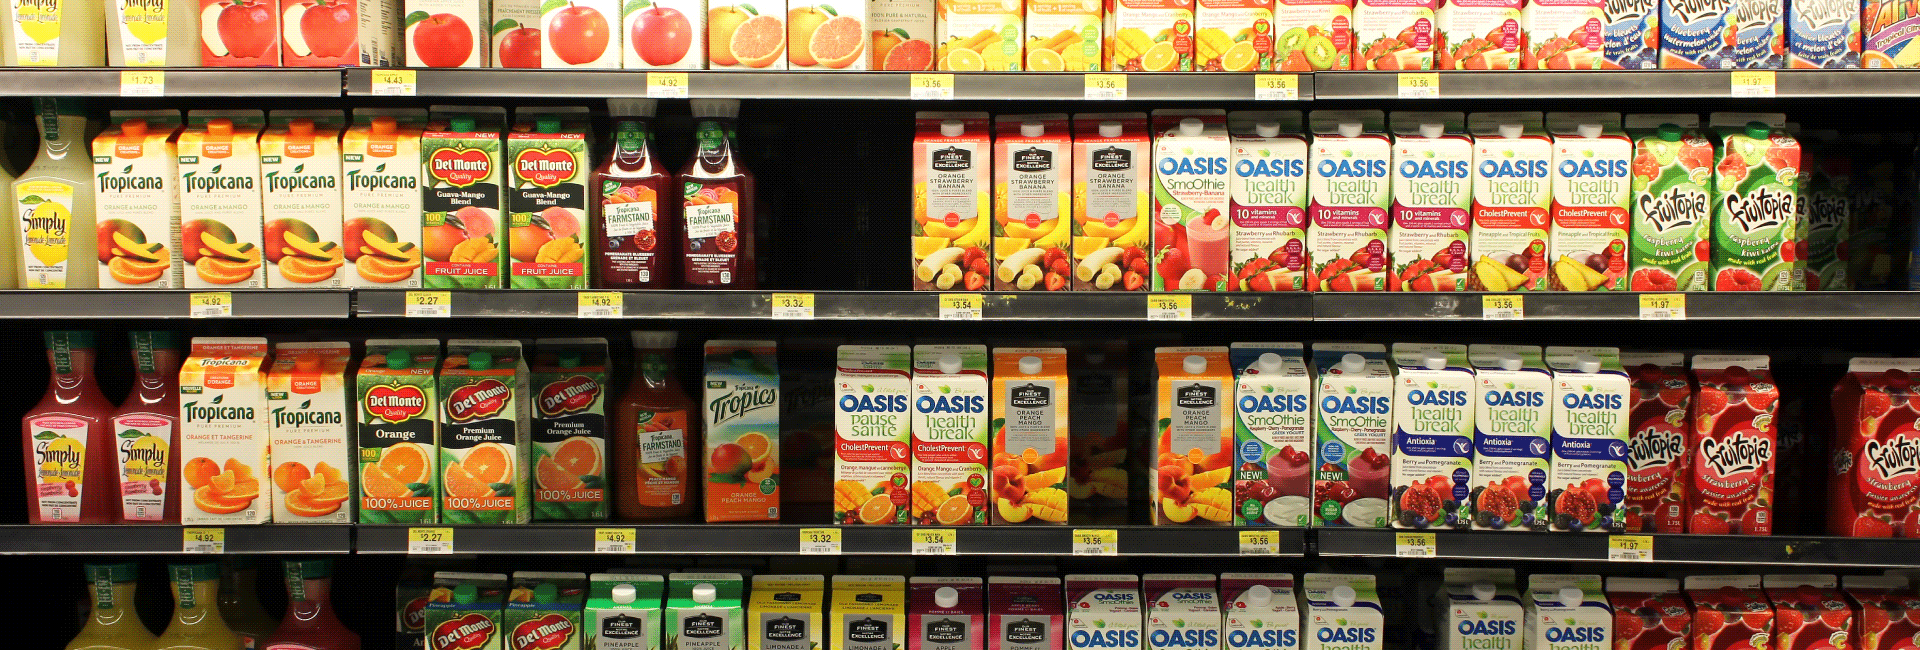
The Decision tree output shows which product attributes are the ones that shoppers aren’t willing to sacrifice when faced with an out-of-stock situation – these are the ones that are the least substitutable. What this means for retailers and manufacturers is that they need to follow the tree to create corresponding (visual) blocks in the planogram. For the top three levels of the tree, it is a must to develop clean blocks that are easy to find on the shelf. The tree levels dictate how substitutable a product is for a shopper. The higher the level, the less substitutable the product is.

The 4 types of shoppers you are dealing with

There is a simple but effective framework for interpreting the decision tree results and identifying consumer segments. Based on our studies, we identified 4 types of shoppers when it comes to brand loyalty – instant switchers, switchers/quitters, risky shoppers and loyal ones!

When you know how the sample spreads across each of these 4 types of consumers, you can start to think about how to assist their shopping and ensure your brand is not overlooked due to a bad planogram. Furthermore, it opens an opportunity to understand whether you have a chance as a replacement for your competitor, where do these buyers come from, and what triggers them to make the switch. A poorly executed shelf is frustrating and can affect sales. 

Shopper-cards

Getting the full picture with a Brand Gain & Loss Analysis

Another valuable output that can be included is a Brand Gain & Loss Analysis – which provides a proportion of shoppers that switched from your brand to Competitive Brand X or who switched from Brand X to your brand, pinpointing when it happened during the shopping process. For an even deeper understanding of the process behind purchase decisions, the stated importance of the attributes, brand recall, dominant occasions and missions as well as ease of shopping and shelf organization are included in the analysis. This allows for a 360-degree view of the shopper and the shelf, by using both implicit and explicit methods in a single study.

The many applications of Behavioral decision trees

Behavioral decision trees are a versatile tool that really helps navigate the complexity of category management, but its benefits spill over to other areas as well. For example, they are most commonly used for shelf optimization and planogram creation. Then, identifying gaps in assortment and looking for areas that are hiding some innovation opportunities. Learnings from these studies can be used as a great source of input for building a communication strategy – since they can uncover relevant purchase motives – for both in-store prompts and on-pack claims. Finally, they aid in distribution optimization – by identifying distinct segments that drive loyalty and require full-time availability at the retailers.

The Behavioral decision tree FAQs

  • Why do decision trees require such a large sample size?

In order to obtain more reliable and stabile insights, the entire tested category and all the relevant product attributes and their levels such as brand, price, type of pack, size of pack, functionalities, and sometimes category-specific attributes should be represented! The only way to ensure all market segments are covered exhaustively, bigger samples are needed! It also depends on the research question, meaning sample sizes can vary from 1000 to 3000 respondents.

  • How are categories defined in behavioral decision trees?

A category is defined by how shoppers group products based on their needs and product interchangeability. For instance, a common definition for cola and non-cola soda drinks should be the “carbonated soft drinks” category because shoppers could switch between cola and orange soda but would not logically use milk to satisfy the same need state. So precision is key when it comes to choosing and deciding on the right boundaries of the category in order to get the most relevant insights about the entire competitive landscape across it.

Interested in learning more? Get the full meta-study findings on how surveys compare to virtual shopping and check out the behavioral decision tree demo!

    Quirk’s webinar: How Brands Can Make a Positive Impact on Social Media and Consumers

    With an overwhelming 2020 behind us, this year has started off with important conversations surrounding COVID-19 and political turmoil. Brands are spending trillions on advertising with the goal of affecting behavior and attitudes but the question remains: Can they leverage it to connect with consumers in a meaningful way and obtain a positive return? At this point, it’s not a matter of if but how to do it right with the social media landscape transforming before our eyes.

    To help break down this new and complex context, EyeSee is conducting multiple behavioral studies leveraging replicated feeds of Twitter, Instagram, Facebook and Google.

    Key Takeaways:

    • How brands can direct their advertising budgets to push for positive change in order to garner both long-term loyalty and tactical ROI.
    • Major do’s and don’t’s of talking about socially sensitive but relevant subjects for brands across industries 
    • Ways to navigate and leverage the fast-changing social media environments and new (shopping) features

      8 years of breaking new ground in market research

      For decades, marketers have realized the massive predictive potential of behavioral research methods. However, as recently as 8 years ago, reaching into the behavioral research toolkit was a rather impractical affair for brands, taking up weeks and big chunks of budget. A clever idea by EyeSee’s founders – to use respondents’ own devices and webcams to follow eye gaze – kickstarted a whole revolution in behavioral research, opening it up to further innovation.

      The principle of using new tech to solve old market research problems worked well and resulted in our team doubling in size every year to meet growing demand from clients such as Twitter, Microsoft, Colgate-Palmolive, J&J, Bayer, Disney, and many more. Our research approach was recognized by Quirk’s and Deloitte; our teams are expanding worldwide, with new team members in Amsterdam and the US Midwest, and an ongoing expansion to Mexico and Singapore in 2021.

      Here are 3 things that breaking new ground (in market research) for the past 8 years has taught us:

      Rule 1: Disrupt, rebuild and grow with tech

      The pandemic has put the world in a tailspin, as uncertainty loomed over both consumer habits and business decisions. The fast pace of the changing world made one thing clear – in-person testing is no longer a (safe) go-to; a place to look for the best and most innovative research solutions is both behavioral and online.

      Tech-enabled research makes it easier to navigate category opportunities through trends as they emerge and stay on top through up-to-date optimization. For instance, brands can now opt to test their marketing materials in realistic virtual replicas of stores, websites, and just about any environment within a couple of weeks. The in-context approach takes into account all platform-specific triggers for consumers and makes for a better indicator of success, whether you are looking into purchase decisions, findability, brand equity, or any other KPI.

      Rule 2: Redefine what market research can do for brands

      Working in MR entails a set of skills for assessing the pulse of trends and understanding consumers that brands should serve. To tap into the full picture, we base our solutions on a combination of eye-tracking, facial coding, Reaction Time Measurement (RTM), and virtual shopping.

      Recently, a study done for Twitter that examined (non)traditional gender roles in sports ads received Best advertising research project recognition at Quirk’s awards. It contributed to the conversation around gender with eye-opening findings and spurred EyeSee to further develop our context-testing Twitter solution and perfect it for future client studies.

      It also prompted us to look into other communication streams such as crisis messaging – specifically BLM and COVID-related. Accumulated insights for 6 different industries are at the forefront of (mobile) market research, altogether redefining what research CAN do for brands.

      Rule 3: Look into the future to better serve the present

      2021 will be about disruption, innovation, and boldness. The entire year, everyone will be out of their comfort zone. To best serve our clients and their needs, we need to be a few steps ahead of them and proactively anticipate how our future solutions fit their business questions.

      So, what do we think will be big next year?

      In-context solutions that map out the online Path to Purchase or multi-channel brand interactions.

      If you aren’t doing this already, this might be the year to step up your social media game and discover a set of best practices for all the channels relevant to your business. Based on your stimuli and content, a study like this can provide you with guidance that reflects each platform’s features, allowing you to leverage them by fine-tuning your content and messaging.

      In the NPD arena, there are so many exciting ways you can test and screen your concepts! Creating entirely behavioral and fully contextual exercises delivers performance info on reliable KPIs such as interest, penetration, and value share. Aside from on-shelf concept screening in different development stages, you can also do behavior tracking on live websites, enabling you to place product concepts and asses them on a real website such as Amazon and see how much interest they garner.

      Finally, all these principles and solutions can be of immense use in all other areas of consumer research. Recreating new contexts in which people interact with your product in any retail environment you can think of – ensures reliable and accurate insights that will help you lead decision-making in 2021.

      Want more? Check out fresh perspectives and strategies for MR shared by our young and brightest talents.

        Thanksgiving, Black Friday, Christmas: Optimizing for a challenging holiday season

        No doubt that the holidays will look different this year – huge lines in front of stores on Black Friday, big family gatherings for Thanksgiving and Christmas, and crowded NYE celebrations all seem like a thing of the past in 2020. New trends emerged, and some burgeoning ones were fortified during the pandemic. From curbside pickups, click-and-collect options, or just good old delivery, both brands and consumers found alternative ways to play their respective parts in the shopping transaction.

        Even though brick-and-mortar holiday shopping is a staple at this time of the year, there is no doubt that the pandemic has permanently accelerated the growth of e-commerce. “At this point, I think we can expect an increase of at least 30% for the peak festive trading season, but if stores have to close, this might push to 50%,” – Andy Mulcahy (Strategy and Insight Director) from IMRG.

        However, be it the holiday season or not – omnichannel optimization and a seamless cross-channel experience are crucial for success with shoppers at the start of 2021!

        The proof is in the advertising pudding

        2020 presented a multitude of opportunities for brands to take a stand on different social issues and communicate timely offers – but the question is, how do you do it right? Our extensive mobile behavioral study found several principles in how seasonal, tactical, and crisis messaging affect brand perception.

        We found that the critical factor in ad retention is personal relevance. Either by way of brands talking about relevant topics, showing they care for their consumers, or through different offers and posts that directly concern the consumer in terms of the product or service that is promoted. Posts that do neither of those perform poorly and are glanced through and not remembered.

        The holiday season is a unique challenge for advertisers – how do you stand out in the sea of the same ads, decorated with similar visual elements and identical keywords? Our study proves just how hard this can be – Seasonal & tactical posts perform the worst when it comes to how innovative and creative the content is, as this type of brand communication is most commonly seen on social media. On the upside, Tactical posts and Seasonal offers are the easiest to understand and Tactical offers have a long retention power – such as posts explaining the rules of a giveaway or discount offers.

        Regardless of the content type, it needs to be optimized for each platform. Are you thinking about using your Christmas TVC for social media as well? An average online video ad is seen only for about 3 seconds, meaning a 20 second-long TVC will most likely flop in a busy social media feed.

        EyeSee and Twitter joined forces to explore which assets are part of next-level holiday ads – here’s what we found out:

        • Ads focusing on gift-giving rather than a family atmosphere increase purchase consideration by 27%
        • Using logos in festive ads boasts a 133% higher brand recall;
        • Attention and brand connection are 10% higher in ads highlighting the product;

        Virtual stores can emulate emerging shopping touchpoints

        How much of this year’s Black Friday will be a Cyber Friday? A rising number of shoppers have now turned to the virtual retail world – some who are first-time online shoppers, and some, like Gen Z, never knew life without online shopping. All the signs are pointing to the unavoidable growing prevalence of e-commerce in the average consumer’s life. Apart from the usual way consumers use online retailers, two relatively new shopping practices have developed: ‘webrooming’ and ‘showrooming’. The first implies the consumer researches about a product online only to then buy it in a physical store, while in the latter, the research is done in the store and the product is bought online. For example, a consumer looking to buy a laptop may go and check it out in the store and then purchase it online. For cases like this, research needs to expand outside of the usual touchpoints to encompass the entire path to purchase and not merely big stops along the way. Thankfully, virtual shopping has developed into more than just shopping off a virtual shelf. 

        Nowadays, you can test all the P2P touchpoints in a variety of 3D contexts, such as specialized stores (tech, drugstore, coffee places), malls, or big retail chains. Virtual stores have evolved to capture behavior in multiple touchpoint scenarios, even if they are new, or hard to replicate en masse with in-person research – such as click and collect, curbside pickups, and numerous others.

        How has online shopping behavior changed during COVID-19?

        We found that the consumers are spending more time browsing the Product listing pages – 50s on average, which led to a 36% increase in noticed products. More time is spent per product as well, by 11% longer than pre-COVID browsing. Similarly, Product detail pages are browsed for almost 20 seconds longer and scrolled through much deeper – nearly 60% of shoppers reach the page end compared to the usual ~5%.

        So even when shoppers are seeing more and more products, exploring them for a longer time and with more attention, and with the numbers are only bound to increase – still, more than half of planned online purchases are unsuccessful.

        Here’s what you can do about it:

        • Good things come in optimized packages – use Hero Images – they increase visibility and with it purchase by 15%
        • Optimize the Path to Purchase – pinpoint precisely where consumers can get discouraged and click off
        • Make sure more products are seen with PLP ads – they also increase product purchase interest by 14% and ensure longer browsing

        How should you be stocking up your shelves?

        It’s not uncommon for certain products to be sold out around the holidays. Though retailers and brands welcome great sales – the possibility of empty shelves that retailers are unable to restock due to supply shortages and chain disruptions is still daunting. If an SKU flies off the shelf, you have several choices:

        • Display the same # of facings for the top tier brands with fewer different items on show (so fewer SKUs)
        • Replace the lost top tier SKUs with more facings of Private Label.
        • Replace the lost Private Label SKUs with more facings of top tier facings.

        If you decide to go for the same number of top-tier brand facings, when the # of different items is reduced, the # of products bought declines by 2%, and the dollar spend declines by 5% compared to the control shelf.

        However, replacing lost SKUs with Private Label facings shows the same 5% decrease in dollar spending (compared to the control shelf). Note that the total units bought remain about the same, suggesting that the lower price accounts for the dollar change we see.

        The third scenario of replacing Private Label SKUs with more A-brand facings increases the average dollar spend by 2%.

        To wrap it up:

        A seamless consumer experience across all channels is critical for the consumer in 2020 – from your online store to social media communication and in-store presentation, showing up with consistently good materials enables a confident end-of-year season for the channel-hopping consumer. Each touchpoint can impact all others: a good online experience drives even brick and mortar shopping, and vice versa. In a high season like this, contextualized omnichannel research in your biggest ally.

          EyeSee wins big at Quirk’s Awards this year!

          EyeSee is the big winner of last night’s Quirk’s Awards, winning the MR supplier of the year (below $10m in revenue), and Advertising research project for our work with Twitter on a pioneering study on (Non)traditional gender roles in sports ads. We are honored that our work was recognized by industry experts and that our long-standing collaboration with Twitter is pushing the boundaries of MR.

          We would like to congratulate Michelle Grushko, Data Scientist at Twitter, for her nomination in the Researcher of the year category, and winning the Advertising research recognition, for a project she led. Michelle emphasized our partnership and the technology that enabled research like this: “We absolutely love working with EyeSee, and consider them such a valuable partner when it comes to answering important research questions and pushing the boundaries such as testing the impact of traditional vs. non-traditional roles in sports ads.”

          She further points out that EyeSee’s platform is particularly effective at capturing users’ behavioral responses when looking at a Twitter timeline as well as virtual shopping exercises to understand shopping behavior. “We are so happy to win alongside EyeSee and we cannot wait for our future collaborations!”. If you are interested in learning more about this groundbreaking study, check out our webinar here.

          Olivier Tilleuil, EyeSee’s CEO and founder, looked back on EyeSee’s growth in the past years: “It is so rewarding to look back on our beginnings almost 8 years ago, and to see how far we’ve come, led by a simple, but bold idea about helping our clients understand consumers with the help of behavioral research. To receive a Quirk’s award for our collaboration with a company such as Microsoft in 2019, and Twitter this year, proves that our expertise and drive are forging a new path in the MR industry. Awards like this are incredibly important for the entire industry, as they are setting a standard, showcasing talents, and nurturing client-supplier bonds. Moreover, they promote innovation to a bigger audience and accelerate adoption of new approaches.”

          EyeSee’s partner, Joris De Bruyne, also commented on the double win: “This honor is a strong wind in our sails further! After a year in which we had to rise to many challenges, it is incredibly exciting to look ahead and plan for new tech optimization and expanding our team into a new operations office in Mexico. To know that we are both the agency of the year and working on relevant topics such as this one is very humbling, and we are very grateful for this opportunity to showcase our team’s work.”

          Congratulations to all the nominees and winners, and many thanks to Quirk’s for hosting a fabulous black-tie event online and continuing to support the market research industry!

          The Marketing Research and Insight Excellence Awards, powered by Quirk’s Media, recognize the researchers, vendors and products and services that are adding value and impact to marketing research. Finalists are selected by a panel of judges made up of a combination of end-client researchers, supplier partners and Quirk’s editorial staff.

            Webinar: Three paths to planogram optimization during the COVID-19 crisis

            The FMCG industry has felt the ripples of the COVID crisis in numerous ways. Retailers and manufacturers are faced with pressures and opportunities brought on by rationalizing SKUs, adjusting assortments, and resetting planograms. In this webinar hosted by Quirk’s, we will discuss a study on Planogram optimization and SKU rationalization in the COVID crisis and the potential paths for brands and retailers.

            Request this session recording now to hear Gina Boyd, (Sr. Manager, Shopper Insights & Category Management, Biscuit at Mondelez International), Johannes Hartmann (owner of Insight Republic) and Jonathan Asher (EyeSee’s Executive Vice President) discuss the study results and how market research can help FMCG companies cope with the effects of the crisis by using both tactical and strategic studies.

            Learn about:

            • Which new planogram path is most beneficial for your brand?
            • What are the best approaches to testing planograms?
            • How can marketing and insights leaders ensure they stay on top both during and after the pandemic?

            Get the recording now for fresh FMCG insights and planogram optimization tips from seasoned industry experts!

              CPG shopping post-COVID: Webinar recap

              After a highly sought-after webinar on September 2, in which Jonathan Asher, EyeSee’s EVP, and Karen Kraft, Senior Consumer Insights Manager, Johnsonville, exchanged opinions on the conflicting trends in the CPG shopping domain, we bring you the best outtakes and conclusions from their conversation. If you missed the webinar – watch the session recording here.

              Online or offline shopping after the novelty wears off?

              When it comes to the way we shop – there are so many factors and moving parts that make up a decision of where to shop. With COVID, things got even more complicated. We dove into how the crisis impacts consumers’ choosing between shopping online and offline shopping.

              Jonathan remarked that during the crisis, some consumers opted to shop online because physical stores were closed or because they wanted to avoid contact with other shoppers, store staff, or surfaces they feared might be contaminated. Some predictions suggest that now that shoppers have made the leap, it’s unlikely that they will revert to their old ways entirely.

              Of course, some who were new to online shopping experienced considerable difficulties – be it technological, out-of-stock, higher prices, or extremely long delivery times. These will likely drive them back to brick and mortar stores, discouraged from trying e-commerce again anytime soon.

              However, as they generally tire of their worlds’ existing online 24/7 – for work, school, socialization, entertainment, and shopping – people will seek in-person, offline engagements wherever they can find them. Shopping for groceries is an easy and accessible way to do so.

              Karen Kraft also feels there is no clear-cut answer: “Online shopping has experienced a step change. It will subside a bit, but many consumers overcame the barriers of first-time use and will have found that it’s pretty easy and convenient and keep some level of online shopping (especially for stock up staples) in their repertoire.” For her, online grocery shopping is likely to net out at two steps forward, one step back.

              How will the recession impact the choice between top tier and value brands?

              Right now, shoppers want to get in and out of the store as quickly as possible. With that, they tend to reach for what is familiar or most readily available. This helps fuel the buying of leading brands, which are both familiar and most prevalent on the shelf – Jonathan said.
              He continues: “At the same time, The coronavirus recession is forecast to be the worst in several decades, meaning businesses and consumers will be cash-strapped for the foreseeable future. As such, they will forego luxuries and shop for lower-priced necessities for the foreseeable future.”
              Karen felt this recession would be different: “While the likely recession/depression will continue beyond COVID (which would suggest value brands/private labels gaining strength), COVID is going to leave new concerns about safety that make consumers feel more confident in top tier/name brands. This will be a net/net, zero-sum game.”

              Will established products reign, or is this the time to innovate?

              Another dichotomy that is worth mentioning is the good-old, established, and iconic brands versus disruptive players and new product developments.

              Having become bored with the routines they had to endure during the worst days of the crisis, feeling more comfortable lingering a bit in stores, Jonathan thinks shoppers will be eager to find new types of products and variations of old standbys.

              “Some products that were popular during the crisis might remind us of negative feelings connected to being quarantined and will be avoided.”

              Karen shared her angle and experience: “Thanks to COVID, consumers are gravitating to the comfortable and familiar. This will continue post-COVID as that is also how consumers behave during a recession (especially those most economically impacted… don’t want to risk wasting money on something they won’t like). That said, close-in innovation that makes the familiar safer, easier, a bit more exciting will likely do well. Trying new things at home is a potential source of entertainment, especially if grounded in the familiar. It won’t be a great time to introduce things that are completely new that aren’t grounded in the familiar.” She also mentioned a new product launch that Johnsonville pulled off with great success during the crisis: Sausage strips – an example of a fresh product that represents a new twist on the familiar.

              Overindulgence vs. a focus on future health

              Since the start of the pandemic in March, many have experienced both ends of this spectrum – indulging in comfort foods and striving to eat better. The question is, how do these behaviors play out in the market?

              Many are allowing themselves to indulge with foods they had previously cut back on as a way to relieve stress. Prior trends of shoppers buying less processed, healthier versions of meal staples are likely to return as routines become more like they were pre-COVID and consumers opt for relatively healthy food options. In addition, the crisis has shed light on the benefits of healthy eating – and good health in general – as a way to be less vulnerable to the effects of the virus.

              For Karen Kraft, the verdict is clear: Comfort foods have roared back during COVID and won’t be going anywhere during the lingering economic woes.

              After testing hundreds of solutions on a global scale, recommendation is simple – the concept of a display needs to be in line with the purpose it’s made for, whether it’s a product launch or strengthening brand equity. For instance, displays for new products need to clearly indicate unique benefits and do not need to hold many stock units. During promotional periods, displays need to highlight the special offer and hold enough products to accommodate the demand.

              There is not a one-size-fits-all solution, but all design elements, the graphics and the structure, need to work together for the same goal. Visibility is not the most coveted result, since displays are inherently noticeable, but to capitalize on that visibility.

              Conclusions

              For the end of the session, both participants shared their key thoughts on the topis. Jonathan Asher offered a strategy to move forward: “We are living in unprecedented times with no clear road map of what is to come or how best to navigate the journey. The best strategy is to continue to understand how consumers are thinking, feeling and behaving – even as it all continues to evolve – and develop product offerings that fill unmet needs, or are better suited to their desires in this moment.”

              Karen Kraft concluded that “The recession that is going to follow COVID is going to be different – traditional recession behaviors are going to be moderated by concerns for health and safety.”

              Watch the full webinar recording below:

                Case study: Planogram optimization during the COVID crisis

                The pandemic has resulted in shortages of ingredients and raw materials, limited plant capacity, supply chain disruptions and changing shopper behaviors. As such, manufacturers and retailers are facing growing pressures – and opportunities – to manage their shelves by rationalizing SKUs, adjusting assortments, and resetting planograms.

                Once it has been determined which items in the branded or Private Label line will be eliminated (either temporarily or permanently), the decision must be made as to how to fill the space that will now be made available on the shelf. Essentially, there are three options:

                1. Display the same # of facings for the top tier brands with fewer items in the line (so fewer SKUs)

                2. Replace the lost top tier SKUs with more facings of Private Label.

                3. Replace the lost Private Label SKUs with more facings of top tier facings.

                Which new planogram path is most beneficial?

                Note: We use the terms A-brand and Top Tier brands interchangeably in this text.

                In order to determine the optimal shelf re-set, EyeSee conducted an extensive behavioral shopping study to identify the outcome of adopting the different approaches. The study tested planograms in the coffee, cereal, chocolate, and yogurt categories to uncover insights for our client’s pressing issues.

                We interviewed 1,200 respondents who were split into 4 cells, and monadically shopped from one of four shelf sets: Baseline/Control; Top Tier brands with same # of facings but fewer SKUs/items; Increased # of Top Tier facings (replacing Private Label SKUs); or increased # of Private Label facings (replacing Top Tier SKUs). Each respondent behaviorally shopped 4 categories: coffee, cereal, chocolate, and yogurt.

                Should retailers increase the number of A-brands or private label facings?

                Importantly, even if the # of facings of top tier brands are maintained, when the # of items are reduced, the # of products bought declines by 2%, and the dollar spend declines by 5% compared to the control shelf. This suggests that replacing those lost SKUs with something else would be a better option. 

                However, when top tier SKUs are replaced by increasing the # of Private Label facings increases, we see that same 5% decrease in dollar spending (compared to the control shelf). This occurs as the total units bought remains about the same, suggesting that the lower price accounts for the change we see.

                While Retailers may have reasons to place more of their own products on shelf given the opportunity, these findings suggest that doing so will result in significantly lower register rings compared to turning over more shelf space to top tier brands instead.

                We do see that replacing Private Label SKUs by increasing the # of A-brand facings, average dollar spend increases by 2% (compared to the control shelf). This occurs as the total units bought remains about the same, suggesting that the higher price accounts for the change we see.

                What does this mean for brands and retailers?

                The shelf is a zero-sum game in terms of space, but not in terms of efficiency – depending on the objectives, some solutions are clear winners for all parties involved– shoppers, manufacturers, and retailers.

                Behavioral research on planogram optimization brings us a step closer to those goals – by helping us understand the way a busy shelf is seen and shopped – with much higher reliability and predictability than if your consumers were to simply tell you what they want on the shelf, or how they think they’d react to a new set up they might encounter at some point in the future.

                As we have seen here, when placed in a shopping context and confronted with alternative scenarios, behaviors will often shift, sometimes in unexpected ways. But knowing this before implementation will allow for smart planning and more profitable outcomes.

                Want to learn more about planogram optimization? Reach out to us via [email protected]

                  The ‘new normal’ in CPG: Understand conflicting consumer behaviors

                  A few months ago, everything changed suddenly as the realities of COVID-19 became evident. Many usual behaviors came to a halt; new ones emerged; old ones re-emerged, and some nascent ones saw their adoption accelerated. On top of that – these behaviors are often conflicting, and it is hard for companies to grapple with the diverging trends. EyeSee’s latest webinar tackles the new realities of the CPG industry and offers advice on how to use behavioral research to make sense of contradicting trends.

                  Tune in to hear Jonathan Asher, EyeSee’s Executive Vice President, and Karen Kraft, Senior Consumer Insights Manager at Johnsonville, discuss CPG shopping and embracing changes in the industry.

                  When? Wednesday, September 2, 10:30 AM EDT / 4:30 PM CET.

                  How? Register here to learn about:

                  • Which of the conflicting trends in the CPG space will impact your business?
                  • What can we learn from our extensive planogram database’s aggregated insights?
                  • Why rely on behavioral insights instead of overconfident predictions?

                  Register now for a learning session packed with actionable tips and industry examples!Register

                  Get a taste of what to expect by diving into our webinar playlist!

                    Behavioral insights for 20/20 vision: Mastering channels and platforms

                    For the end of 2019, we compiled a list of most valuable behavioral insights that will give you a clear view in 2020. These insights are platform- and channel-specific, making them highly actionable and tailored to the environment in which you are operating. Read on for the best of our knowledge built up by examining various shopper, social media, and e-commerce solutions.

                    Top 5 behavioral insights for 2020, by channel:

                    1. Brick-and-mortar

                    Stated purchase intent overestimates actual purchase behavior by 25% to 70%

                    Let’s get back to the self-evident basics – what consumers say is not always what they actually do. This is a part of what makes us human and how our brains are wired – we are biased when making assumptions about the future, and very often overly optimistic when claiming that we would try or buy a product. When we get to an actual store, our behavior is influenced by a million other factors, and we often make purchase decisions in a split second, powered by our System 1 thinking. In a traditional research setup, e.g., a focus group or a survey, we can take our time and use our System 2 thinking to formulate the right decision and opinion.

                    That is where behavioral research steps in – it allows us to bypass all the pitfalls of decision-making and get to the hard-wired behaviors, as shown by our gaze patterns, facial expressions, and quick reactions.

                    Knowing this, you won’t be surprised by the fact that the stated purchase intent is wildly overestimated in comparison to shopping behavior in front of a virtual shelf in some of the studies we conducted. Using purchase intent as a vital KPI when measuring the potential success of your product is unreliable and risky.

                    We believe that purchase intent should be measured in a relevant context with real products. If you rely on asking people about their intent, they might overestimate the chances of buying the product by 70% – this doesn’t sound like a very good metric to base business decisions on.

                    On the other hand, studies have shown that virtual shopping has a very high and reliable correlation with real, in-store data by Nielsen – as high as 0.8. Virtual shopping and other implicit methods are much more reliable in assessing the true potential of your products or marketing materials.

                    Be wary of what consumers say – it’s what they do that counts.

                    2. Twitter

                    6 seconds – enough time to get a message across in a Twitter ad

                    Recent studies have shown that video ads are incredibly compelling – they can create brand impact in a matter of seconds after playing. Our mobile advertising study for Twitter found that short-form, clearly branded, sound-off videos, significantly improve ad recall and message association.

                    Based on the results of our study, Twitter has recently introduced a completely new ad format – biddable six-second video ads. In it, advertisers will only be charged after their ad is viewed for at least six seconds, with at least 50% of the pixels, effectively ensuring they pay only for the genuinely interested viewers. This is another exciting format innovation from the team at Twitter, who are continuously exploring unforced and serendipitous ways to help the users get promoted content that matters to them.

                    How do you optimize your ads to make the most of Twitter’s platform?

                    Make the content clearly branded – tweets with both the logo and brand included generated 13% more buyers. Additionally, mentioning the brand in the post copy, AND using a product shot in the footage also increased purchase intent. When it comes to the position of the logo, we found that the upper left corner (the one closest to the avatar/user name/profile pic) works the best for boosting recall.

                    3. Facebook

                    In-context social media testing is far superior to forced exposure

                    It is not easy to grab the attention of ad-avoidant consumers of the digital era. We are always surrounded by a slew of messages and visuals – which is why showing a standalone, full-length ad during advertising testing is just not going to cut it. Why? Aside from a delayed and conscious ad assessment, this approach entails forced exposure of the tested material to the consumer. A critical precondition to evaluating ads is checking if they manage to reach the consumer and get noticed in its natural environment, to begin with.

                    If the visibility for a tested post is 100% in standalone mode with a 30% visibility of the brand name in the last few seconds of the video, and the same ad has an 80% in-context visibility, you can expect that the brand will be 20% less visible in this case as well. If you only test in standalone mode, you might get useful information about the later parts of your ad – but the fact is that most people don’t get past the first 1-3 seconds of the ad. Forced exposure can often provide you with overly optimistic insights.

                    Testing in context is vital, and settling for less-than-convincing testing environments will soon become a thing of the past. We should strive to get testing conditions as close to reality as possible. So far, we have two great options: simulated social media feeds, and ad insertion in the respondent’s own feed. Our study shows the two methods yield the same insights, regardless of the difference in browsing behaviors: users browse slightly faster through their own feeds than through simulated ones. Still, both testing environments delivered the same conclusion on the tested ads, supporting the other method’s accuracy with findings.

                    A cherry on top: Ads on the top of the feed have significantly higher attention

                    Another thing this study shows us is that the position of the tested post in the feed makes for quite a big difference. Ads positioned near the top of the feed have substantially higher visibility – this is expected and makes sense. Curiously, aside from higher visibility, the ads on top of the feed also had higher attention – 4.6 seconds vs. 3.4 seconds for the last ad in the feed – meaning the quality of the interaction with the ad was higher. Posts that were on the second position in the feed had a visibility of 94%, posts that were on the seventh position 89%, while 75% of viewers saw the posts positioned as the 12th in a row. For us, this is important to keep in mind and vary in our environment design to ensure the highest standards and accuracy of our methodology. Since we can test multiple ads in a single test, we need to make sure we account for the influence of their positioning. However, the advertiser’s industry can also affect this – for example, ads for travel services had below-average attention and visibility even on the top spot in the feed.

                    More interestingly, though, is will Facebook find another way to monetize this insight? Higher visibility means Facebook’s algorithm ensures the number of impressions by moving certain posts higher up in the feed – but higher attention is vital for advertisers as well. Finding another way to secure a top spot in the feed for a certain period would be a win for brands and the platform alike – we have Twitter’s successful First view ad format to prove it. Although there are considerable differences between the two platforms, we feel that this data speaks for itself. The sooner people see the post when scrolling, the more people will notice it, spend more time looking at it, and recall the brand better.

                    4. YouTube

                    The ratio of skippers vs. watchers on pre-roll videos is around 80:20

                    We recently developed a contextual testing solution specifically for YouTube ads – this enabled us to look into how people engage emotionally and interact with pre- and mid-roll advertisements on the platform. As you already guessed, our study confirmed what we all assume – most people click the skip button as soon as they get the chance. Almost 80% of viewers skip the ad at some point. We were curious to learn more about watching behavior and find ways to combat the intimidating stats. On average, only 20% of watchers continued watching the video in entirety, and 53% of the video’s length was watched.

                    What can you do about this? 

                    Use lively and uplifting music and present innovative claims throughout the video. Try to hook the viewers, primarily focusing on the seconds right before the skip button appears. More than half of viewers skip the ad in the first two seconds after the button shows up, so try to boost interest during those seconds – even though 5 seconds sounds short, in video ad real estate, that is just enough time to convey the main message. Also, for boosting brand recall, make the brand name or logo visible right off the bat.

                    When it comes to pre- and mid-roll ads, YouTube has a different set of practices when compared to other, scrollable platforms. People who watch content on YouTube are mostly quite motivated to stay on the page for the duration of the ad to access the content they are interested in. On the other hand, ads on Facebook might make people give up on the content they meant to watch if they have to wait for it, only by scrolling past it. Advertisers should keep this in mind and try to make their ads as relevant to the audience. In those few seconds, before the button appears, they have a considerable chance to arouse interest and keep people watching. After all, if their attention is stuck to the flow of the video, it is as easy as not clicking anything.

                    5. Amazon

                    PLP ads on top of the page significantly increase the visibility of the same SKU in the list

                    We test 40 e-commerce sites a year, and there is one curious insight we came across this year while conducting a comparative study of 3 retailers across 4 categories. To make sure we cover different consumer decision strategies, we’ve included non-food and food categories, and to break it down even further, some of them are impulsive (e.g., chocolate), and some are habitual (cereals, coffee).

                    We explored how different elements of the retailer’s pages influence shopping behavior, and additionally, how ads found on PLP pages affect the performance of advertised SKUs. Knowing that only a small fraction – 2% of people – end up clicking on the ad itself, we wondered, is it worth placing an advertisement on PLP pages? Are the ads even seen at all, or is there banner blindness? What is the impact of the position of the ad?

                    Although almost no one clicks on the ads, they do influence shoppers in another way. The way this happens is that the ads subconsciously drive interest in the advertised product, which then gets purchased on its primary position, i.e. the list.

                    However, this does not work for all products and all categories equally. An uplift in brand purchase can be as high as 40% for different categories, but as low as non-existent for others. We found that if the SKU/product shown in the ad is also available on the list, shoppers are significantly more likely to buy it.

                    If the communicated SKU is not available on the list (but other representatives of the brand are), the purchase interest might not be affected. Ads at the top of the pages were seen on average 3.9 seconds while ads on the side positions are seen for 1.3 seconds.

                    Aside from this, there are several other benefits of product list pages that include ads: users browse lists with ads 20% longer than their ad-free counterparts. Online shoppers see 10% more products overall on pages that contain ads, and as a result, there is a 14% increase in product purchase interest.

                    Conclusion

                    Regardless of the channel or platform, it is essential to explore the implicit effects they have on your target audiences. Some of these insights are universal to our day and age and work on more than one platform – for example, short-form videos work better on both Facebook and Twitter. Likewise, contextualized testing has the upper hand on both of them in comparison to standalone testing. However, to master them thoroughly, we suggest having separate research strategies and approaches to testing the performance of your product on the ones that have the highest ROI for your business.

                    This list is just a fraction of the curious and diverse batch of insights we discover in each of our studies – use them in 2020 for a sharp vision of each medium.

                      Thanks for your interest!

                      We”ll get back to you promptly